
Wrike is not a lightweight project tool. Unlike Kanban apps or simple to-do managers, Wrike has invested seriously in work management depth: customizable workflows, request forms, blueprint automation, dashboards, and a Gantt chart with genuine dependency support. It has earned a real following among marketing teams, creative agencies, IT operations, and professional services organizations that need structure and automation across a large team's work.
That makes this comparison more nuanced than most. Wrike does offer a Gantt chart. It supports three of the four standard dependency link types. On its Business plan, it can highlight the critical path. These are real capabilities, and they deserve honest acknowledgment. But there are specific areas where Wrike's scheduling depth stops — and where those gaps matter most for project managers who are accountable for delivering complex work on time. This comparison examines those gaps directly.
Quick Verdict
Wrike excels as a work management platform for teams that need structured workflows, automation, and rich dashboards. Its request forms, blueprint automations, and approval workflows are among the best in the market. For marketing and creative teams coordinating high-volume work across many contributors, Wrike's strengths are genuine.
But Wrike is built for managing work, not for scheduling it with analytical precision. CPM scheduling is locked behind its most expensive plan tier. There are no project baselines — once you update task dates, the original plan is gone. Wrike tracks people but not equipment or materials, which means any project where machine availability or supply constraints matter must manage those resources outside the tool. And its AI — branded as Work Intelligence — focuses on task prediction and content generation, not on building or restructuring the actual schedule.
For project managers whose work demands scheduling discipline — Maverick is the stronger Wrike alternative for project scheduling.
Quick-Reference Comparison Table
The comparison above, summarized as a plain data table.
| Feature | Maverick | Wrike |
|---|---|---|
| Gantt + CPM Scheduling Engine | ✓ Full CPM — all plans | ~ CPM locked to Business plan |
| All Four Dependency Link Types | ✓ FS · SS · FF · SF + configurable lag | ~ FS · SS · FF only — no SF |
| Human · Machine · Materials Resources | ✓ All three types — each with own schedule | ✗ People (users) only |
| Project Baselines & Variance Tracking | ✓ Ghost bar Gantt | ✗ Not available |
| AI Builds & Reschedules Projects | ✓ Native AI builder · per-employee models | ~ Work Intelligence — no schedule builder |
| Built-in Employee Timesheet | ✓ Full reporting — all plans | ~ Basic time logging |
| Resource Allocation Bar Chart | ✓ Color-coded — human, machine, materials | ~ Workload view — people only |
| Workflow Automation | ~ Basic automations | ✓ Forms · blueprints · approvals |
Feature Comparison at a Glance

The pattern in the table reflects the fundamental difference between the two tools. Wrike leads on workflow automation — its forms, blueprints, and approval routing are a genuine differentiator. Maverick leads on every scheduling-specific category: CPM availability on all plans, all four dependency link types, three resource types, project baselines, and native AI schedule building. These are not marginal gaps; they reflect tools built with different primary purposes.
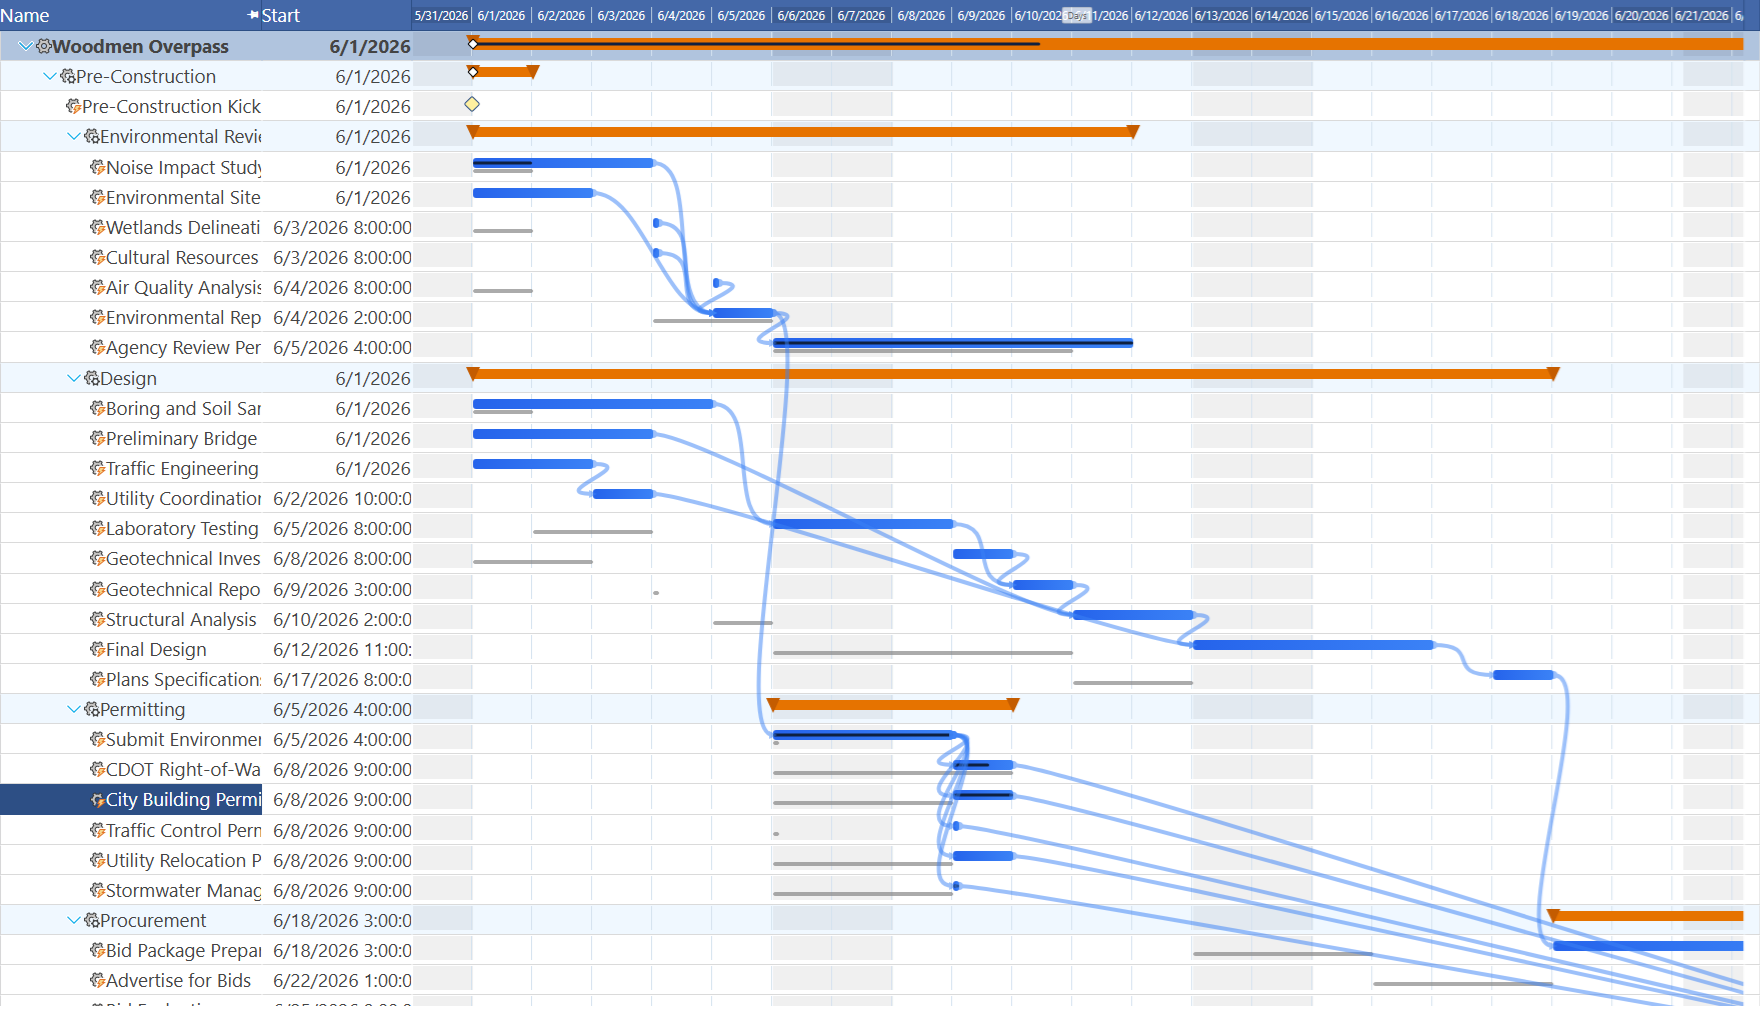
Gantt Chart and Scheduling Engine
Maverick wins on depth and accessibility. Wrike's Gantt chart is more capable than many in this comparison category. It supports drag-and-drop scheduling, inline task editing, and dependencies between tasks. For a work management platform, that is meaningful. But the CPM engine — the feature that tells you which tasks control your project end date and how much scheduling slack each non-critical task has — is locked behind Wrike's Business plan at $24.80 per user per month.

Even on the Business plan, Wrike's CPM implementation highlights the critical path without providing per-task float analysis — the specific number of days each non-critical task can slip before it becomes critical. Maverick provides full CPM on every plan at $8.99 per user per month: critical tasks highlighted in red automatically, float values calculated for every non-critical task, and dependency cascades that update the entire schedule when one task moves. The scheduling engine is always on, always visible, regardless of plan tier.
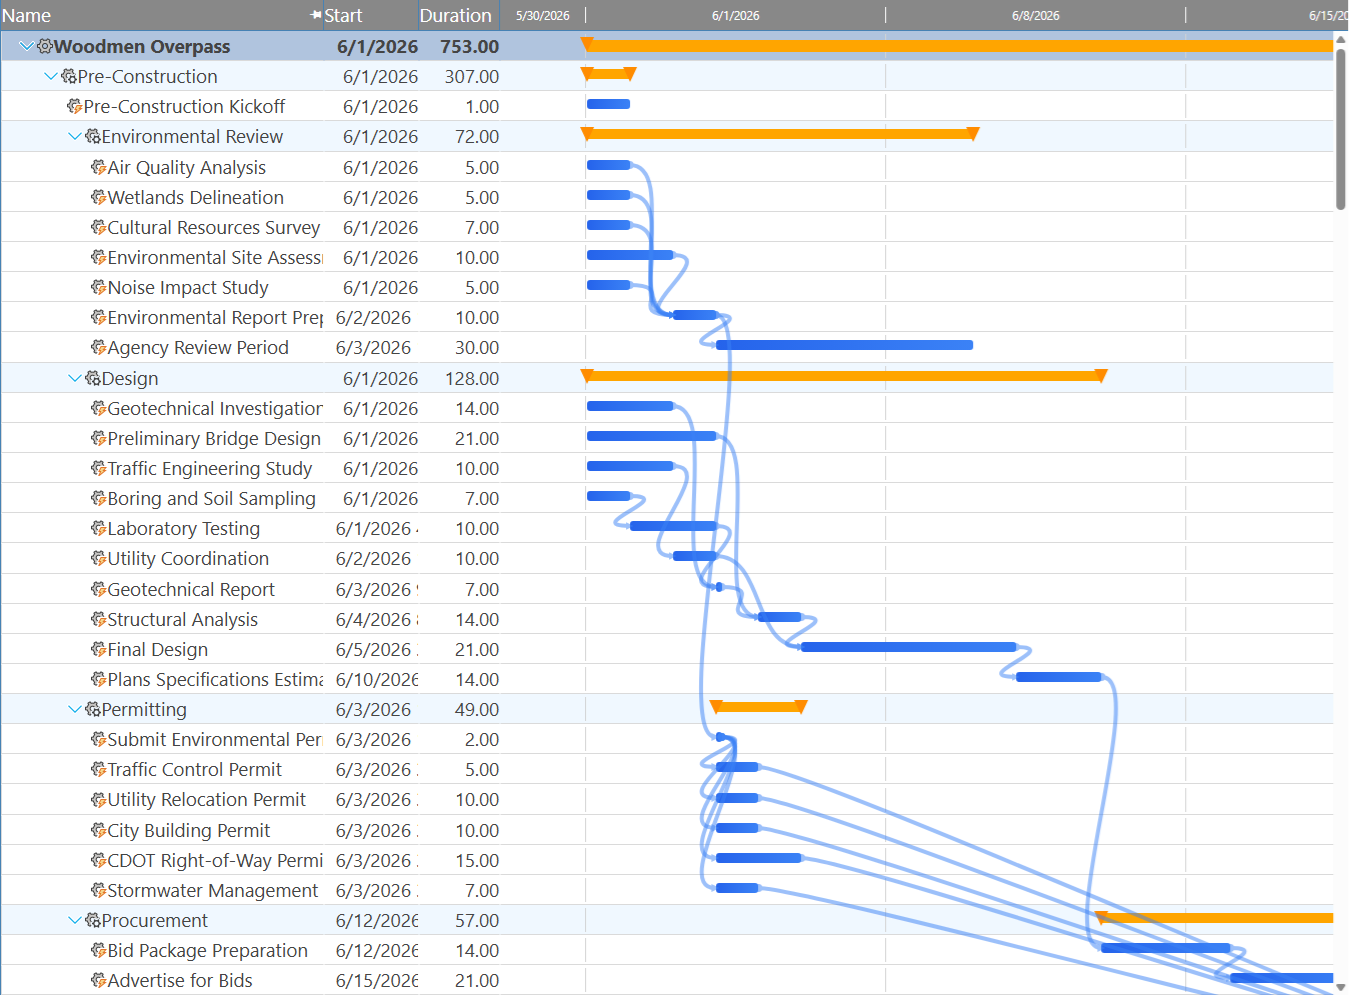
The Gantt chart above shows Maverick's dependency link lines connecting tasks sorted by start date. Each link type is represented differently, and the schedule responds automatically when any task changes. This is the kind of scheduling engine discipline that distinguishes a project scheduling tool from a work coordination platform.
Dependency Types: Three vs. Four
Maverick wins on completeness. Wrike supports three of the four standard dependency link types: Finish-to-Start, Start-to-Start, and Finish-to-Finish. That is meaningfully more than tools that support only Finish-to-Start, and it covers the majority of real-world dependency relationships. But the fourth type — Start-to-Finish — is not available in Wrike.
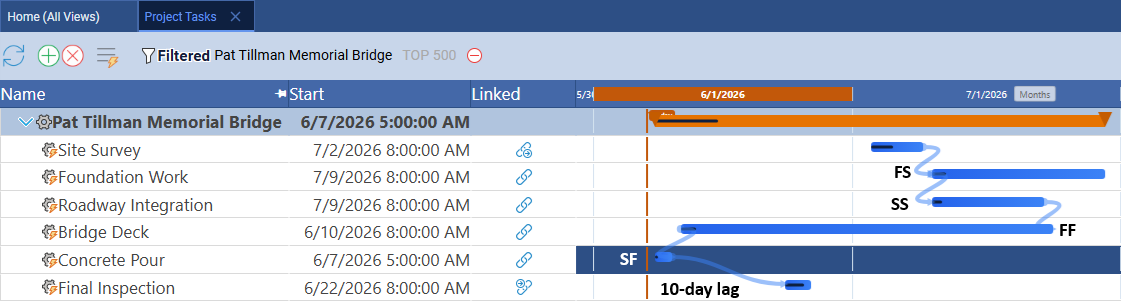
Start-to-Finish (SF) is the least commonly needed dependency type, but it exists specifically for scheduling scenarios that cannot be expressed any other way: a successor task that must finish by the time a predecessor starts — most often seen in shift handovers, regulatory sequencing, and certain production pipeline constraints. Maverick supports all four types with configurable lag days on every relationship. Wrike handles three and stops. For projects that require the full set of scheduling relationships, Maverick covers the complete standard.
Critical Path Analysis
Maverick wins — full CPM on all plans with float analysis. Wrike's critical path feature, available on Business plan and above, identifies the sequence of tasks that controls the project end date. That is a meaningful capability that many competitors in this category lack entirely. But two limitations constrain its analytical value.
First, Wrike's critical path highlighting is plan-gated — it requires the Business plan at $24.80 per user per month, nearly three times Maverick's all-inclusive price. Second, Wrike does not display per-task float values: the specific number of days each non-critical task can slip before it joins the critical path. That number is essential for prioritizing attention, explaining schedule risk to stakeholders, and making informed decisions when delays occur.
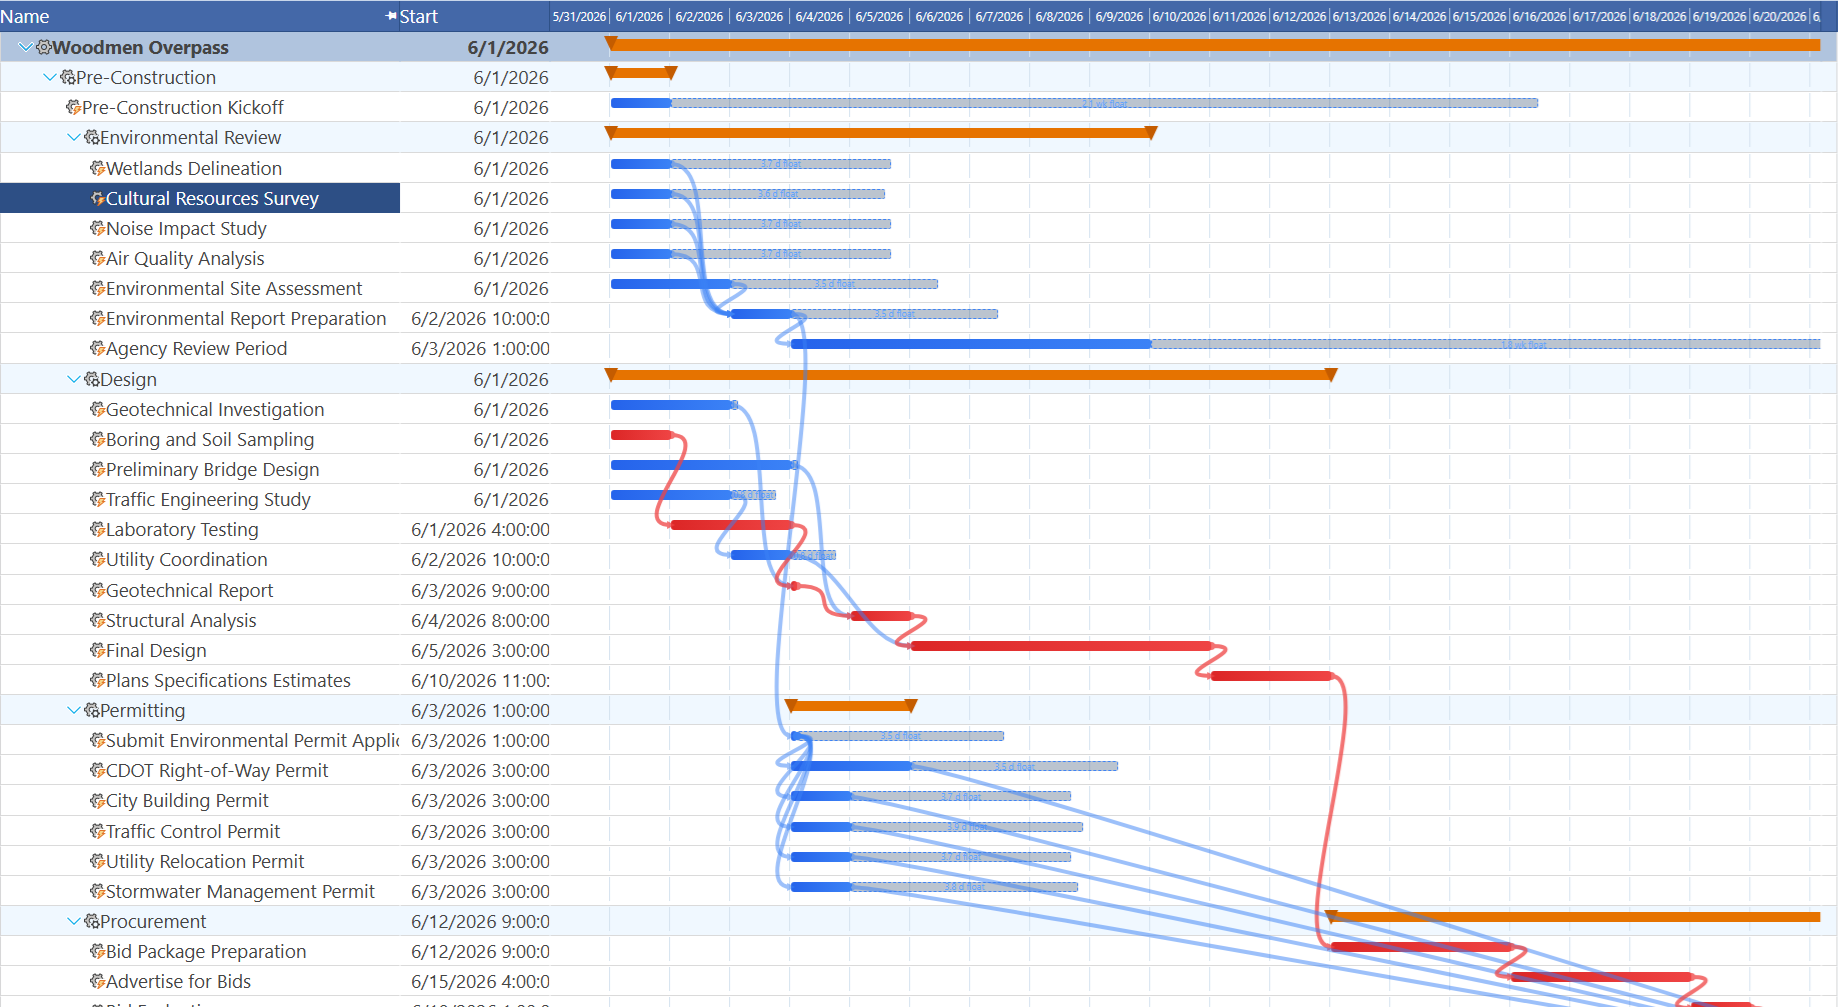
Maverick calculates the critical path continuously on every plan. Critical tasks appear in red automatically. Float values appear alongside non-critical tasks. When any task changes, the entire CPM calculation updates immediately. You always know which tasks cannot slip, which have buffer, and where to focus when a problem emerges — without upgrading to a more expensive plan.
Resource View: Human, Machine, and Materials
Maverick wins decisively. Wrike tracks people only. Every project management tool tracks people. Wrike assigns tasks to team members, shows workload per person, and lets managers balance assignments across their team. For projects where resources are exclusively human, that coverage is sufficient.

Real-world projects are rarely that simple. A construction project cannot be scheduled without tracking concrete mixers, dump trucks, and concrete pumps alongside the crew. A manufacturing project depends on machine availability as much as labor availability. An event has equipment, materials, and venue constraints that are just as likely to derail the schedule as a key person being unavailable. These resources have their own schedules, availability windows, and utilization limits — and they can be overloaded just like a person.
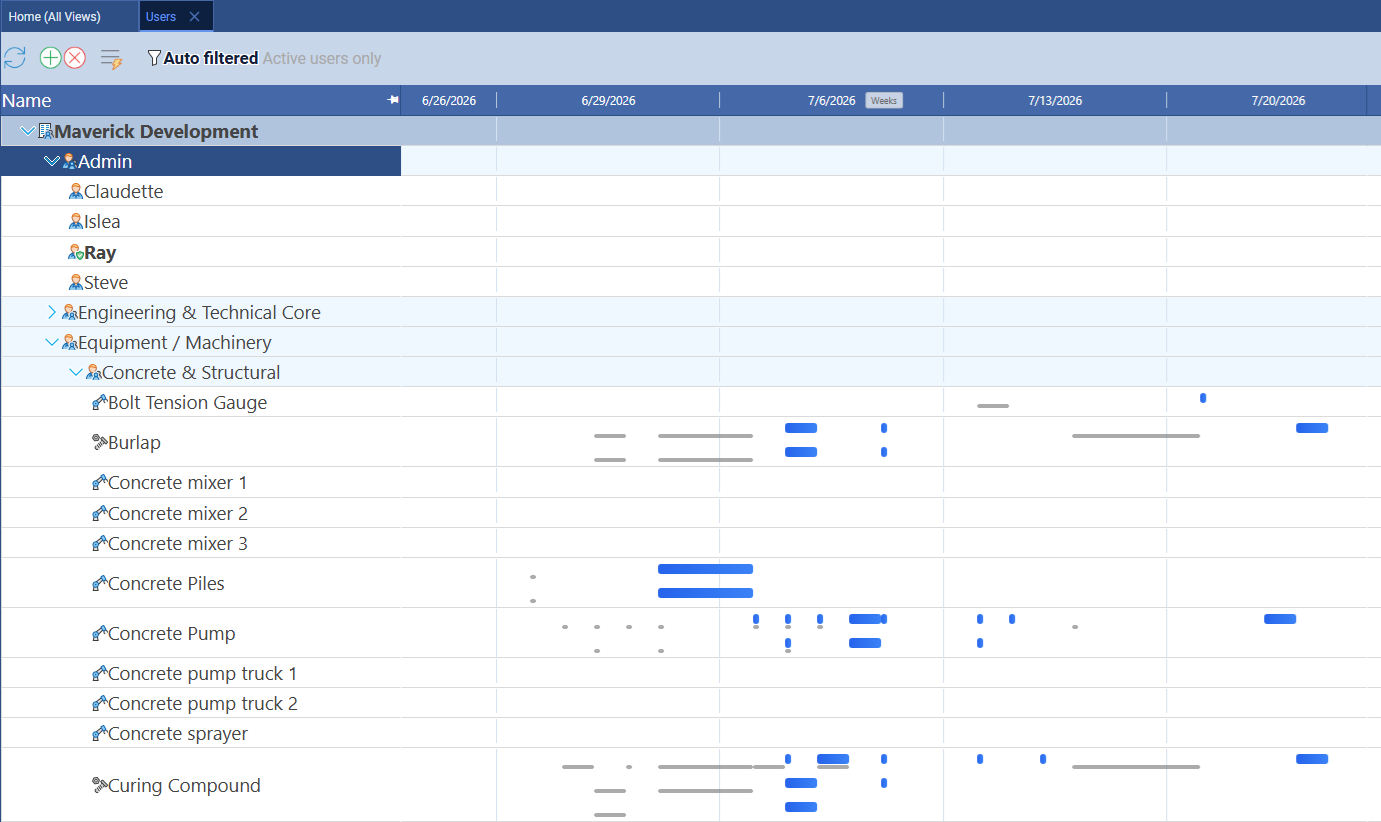
The screenshot above shows Maverick's Users view with all three resource types in a single hierarchy: human team members grouped under Admin and Engineering, equipment listed under Equipment / Machinery (Concrete & Structural), and materials alongside them. Task bars appear in the Gantt column for each resource based on their actual assignments. Every resource type is scheduled on the same timeline, and every resource type generates allocation data that flows into the resource allocation bar chart.
Wrike has no concept of equipment or materials as schedulable resources. When a critical machine is double-booked or a material supply constraint threatens a delivery date, Wrike offers no way to see, model, or resolve that conflict inside the tool. Those constraints must be managed in spreadsheets or external systems — invisibly, outside the schedule.
Resource Filtering and Workgroup Isolation
A second advantage of three resource types: the ability to filter and isolate them. When all resource types are visible simultaneously, the resource list can span dozens of rows — humans, machines, and materials interleaved in a way that makes it difficult to focus on any one category. Maverick lets administrators filter the Users page by resource type, collapsing all other categories and showing only the selected type.

Filtering to Equipment / Machinery, for example, shows only machines and their task assignments — nothing else. Within that isolated view, scheduling conflicts become immediately visible: if two tasks assigned to the same piece of equipment overlap in the same week, those task bars overlap in the Gantt column. That is an overload, in the same sense that a person assigned to 16 hours of work in an 8-hour day is overloaded.
The filter view is a form of resource leveling. You isolate the resource type you want to analyze, scan for overlapping task bars, and identify which assignments need to shift — either to a different time period or to an equivalent piece of equipment — to eliminate the conflict. The resource allocation bar chart (covered below) provides the color-coded quantitative view of the same data; the filtered Gantt provides the timeline context that makes the fix intuitive.
Because Wrike does not model equipment or materials as resources at all, this analysis cannot happen inside Wrike regardless of plan tier. The constraint simply does not exist within the tool's data model.
Resource Allocation Bar Chart
Maverick wins significantly. Wrike includes a workload view that shows tasks assigned to team members across a time range, with a visual indication of how many tasks each person has in a given period. It is a useful high-level signal and can help prevent obvious scheduling mistakes. But the workload view is a task-count display, not an allocation model.
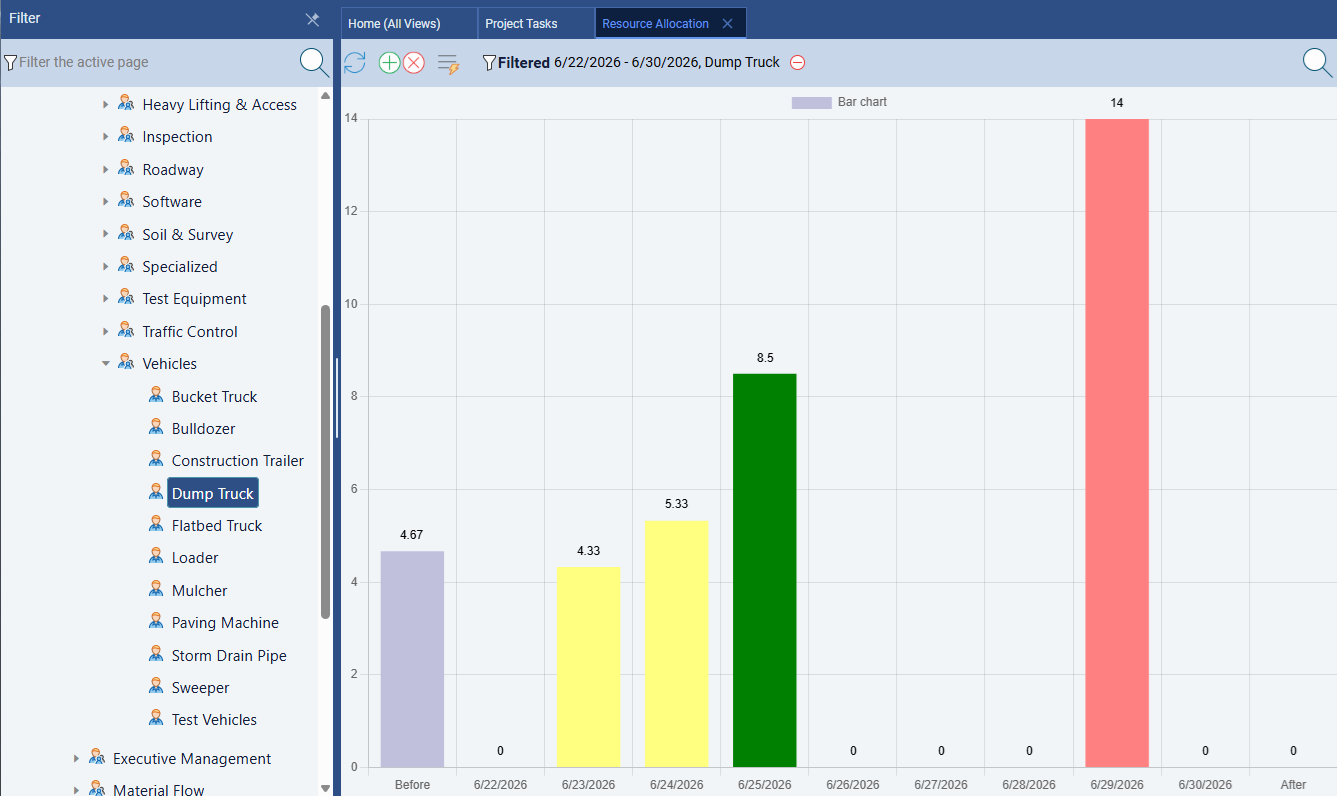
Maverick's resource allocation bar chart calculates utilization by hours — not by task count — against each resource's defined working schedule. The bar chart uses three colors: green for resources that are correctly loaded, amber for those that are under-utilized, and red for those that are over-allocated. The example above shows this in action: the Dump Truck appears in red because two tasks have been scheduled simultaneously, consuming more hours in that period than the machine's availability allows.
That same Dump Truck conflict is the one that becomes immediately visible in the filtered Equipment view described in the section above — the allocation chart and the filtered Gantt work together. One gives you the quantitative signal; the other gives you the timeline context to resolve it. Both operate across all three resource types — humans, machines, and materials — which is something Wrike's workload view does not and cannot do.
Project Baselines and Variance Tracking
Maverick wins. Wrike has no project baseline feature. A project baseline is a snapshot of the approved plan at kickoff — the dates, durations, task sequences, and resource assignments as agreed before work begins. As the project executes, you compare actual progress against the baseline to see how far the plan has drifted and where. Baseline comparison is a standard requirement for stakeholder reporting in construction, IT delivery, engineering, and professional services.
Maverick stores baselines natively and displays ghost bars on the Gantt chart — transparent bars showing the original position of each task alongside the current scheduled bar. The comparison is always visible. You can see immediately whether the project is running ahead or behind plan, explain variance to stakeholders in seconds, and trace which changes caused the schedule to drift from the original commitment.
Wrike has no native baseline feature. Once you update task dates in Wrike, the original dates are gone. There is no way to answer the question "how does our current schedule compare to the plan we agreed at kickoff?" — at least not within the tool. For project managers who are accountable to sponsors, clients, or executive stakeholders for explaining schedule performance over time, this is a fundamental gap. Maverick stores that comparison automatically on every plan.
AI Scheduling
Maverick wins on scheduling AI. Wrike's AI serves a different purpose. Wrike's Work Intelligence platform includes genuinely useful AI capabilities: risk prediction on projects with early warning signals, smart suggestions for task assignees based on historical patterns, AI-generated status report summaries, and automations triggered by project data. These are valuable for managing high-volume work across large teams, and they reflect real investment in machine learning applied to work management.
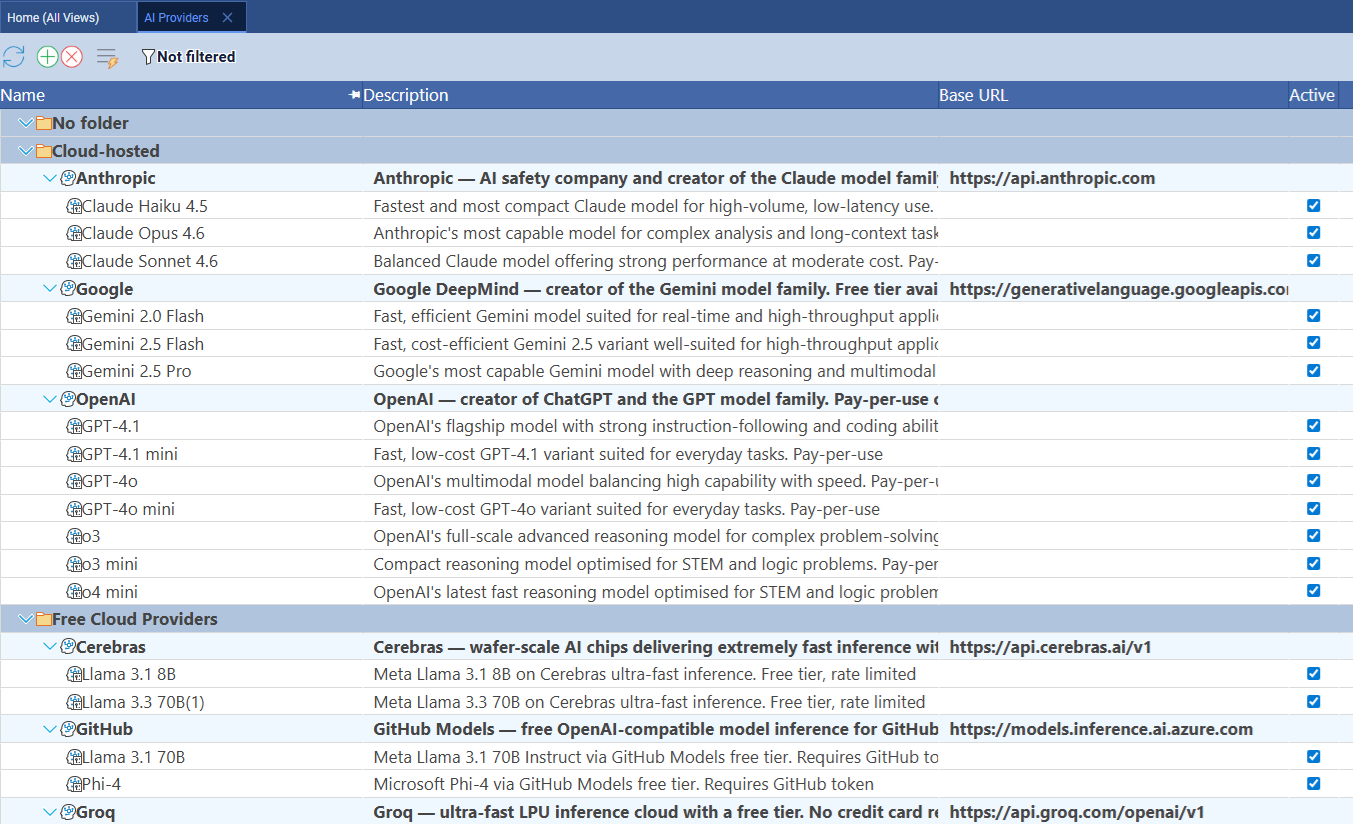
But Wrike's AI does not build a project schedule. It does not read a project brief and generate a structured plan with tasks, dependencies, resource assignments, and a critical path. It does not respond to a natural-language instruction like "reschedule everything after a two-week delay and identify which tasks are now critical" by restructuring the actual schedule. Work Intelligence analyzes and reports; it does not plan.
Maverick's AI reads your project — its tasks, dependencies, resource assignments, constraints, and timeline — and acts as a scheduling assistant that can build or restructure plans from plain-English instructions. You can describe a new project and receive a structured schedule with dependencies and assignments in seconds. You can ask the AI to identify tasks with no resource assigned, flag scheduling conflicts, or model the impact of a delay on the critical path. Maverick also supports per-employee AI model assignment: power users can run a premium model while the broader team uses a cost-efficient one, all within a single account.
Time Tracking and Timesheets
Maverick wins for integrated project time tracking. Wrike includes time logging on paid plans. Team members can log hours against tasks, and managers can view time spent reports. For basic use cases — confirming that work happened and roughly how long it took — Wrike's time logging covers the need.
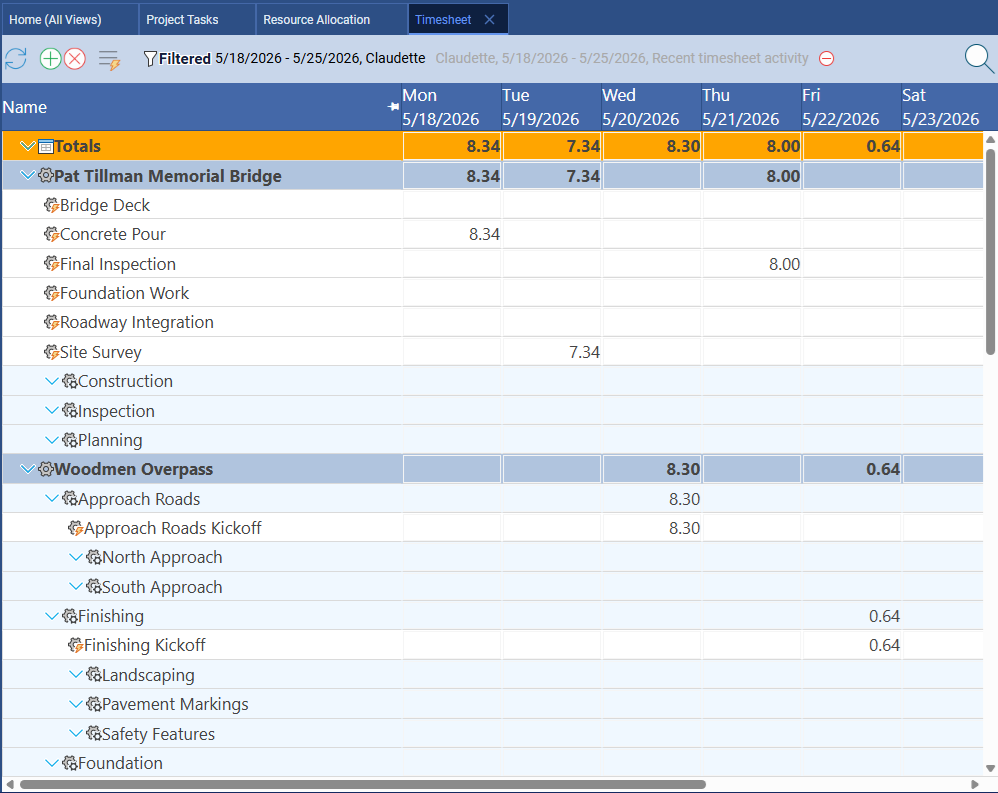
Maverick's built-in timesheet is a full employee timesheet integrated directly with the project schedule. Team members log actual hours against specific tasks, and those actuals feed automatically into project cost calculations and resource allocation reporting. Managers filter timesheets by user, project, or date range to see exactly where time is going across the team. The timesheet connects directly to resource allocation data so planned versus actual utilization is always calculable — no manual reconciliation required. It is available on all plans with no additional configuration.
Workflow Automation
Wrike wins this category.
Wrike's workflow automation capabilities are among the strongest available in any project management platform. Request forms route incoming work to the right team with the right metadata automatically. Blueprint templates create pre-configured project structures in seconds. Approval workflows route deliverables to the right reviewers with escalation rules. Automations trigger task status changes, notifications, and assignments based on project events. For teams that process high volumes of incoming work — marketing requests, creative briefs, IT tickets, onboarding tasks — Wrike's automation layer saves hours of manual coordination every week.
Maverick is purpose-built for project scheduling, not process automation. Its automation capabilities are limited to the scheduling domain: dependency cascades, AI-driven plan updates, and resource conflict alerts. Organizations that need the kind of intake-to-delivery workflow orchestration that Wrike provides would find Wrike's automation layer more sophisticated. If that workflow automation is the primary requirement alongside basic Gantt scheduling, Wrike's strength here is worth weighing honestly.
Dashboards and Reporting
Wrike wins this category.
Wrike's dashboard and reporting tools are highly configurable. Managers can build custom dashboards with task lists, chart widgets, burndown charts, and project status summaries that update in real time. Cross-project reports can surface at-risk work, overdue tasks, or resource utilization across an entire portfolio. For executive-level visibility across many simultaneous projects, Wrike's reporting layer provides the kind of bird's-eye view that operations managers and program directors need.
Maverick's reporting is focused on the project schedule: Gantt charts, critical path analysis, resource allocation bar charts, and timesheet summaries. These provide the analytical depth that project managers need to manage individual projects with precision. Wrike's cross-project portfolio dashboards go further for organizations managing dozens of simultaneous projects across multiple teams. If aggregated portfolio visibility and customizable executive dashboards are central requirements, Wrike's reporting depth is a genuine advantage.
Pricing
Maverick delivers more scheduling depth at a significantly lower cost.
Wrike's per-user pricing scales with plan tier and feature access. The Team plan at approximately $10 per user per month provides basic Gantt and task management but no CPM scheduling. The Business plan — required for critical path analysis, advanced resource management, and reporting — runs approximately $24.80 per user per month. Enterprise pricing is custom and higher still.
Maverick's Starter plan at $8.99 per user per month includes everything covered in this comparison: full CPM scheduling on all plans, all four dependency link types with configurable lag, three resource types with allocation tracking, project baselines with ghost bar comparison, AI schedule building with per-employee model assignment, and the built-in timesheet. There is no plan tier that unlocks the scheduling engine — it is always on.
A team of ten project managers on Wrike Business pays 10 × $24.80 = $248 per month. The same team on Maverick pays 10 × $8.99 = $89.90 per month — with more scheduling capability than the Wrike Business plan provides. Maverick does not offer a permanent free tier but provides a full-featured free trial so you can test the CPM engine, resource allocation tools, and AI scheduling before committing.
Final Verdict: Which Tool Should You Choose?
Wrike is a serious work management platform that earns its place in enterprise environments where workflow automation, structured intake processes, and cross-project portfolio visibility are the primary requirements. Its request forms, blueprint automations, and approval workflows are genuinely best-in-class for teams managing high volumes of incoming work. If your organization's primary challenge is coordinating large teams across many simultaneous projects with complex intake and approval processes, Wrike's strengths in that domain are real.
But the distance between work management and project scheduling is significant, and Wrike's design reflects that distinction. Its CPM scheduling is plan-gated. Its resource model covers people but not equipment or materials. Its AI analyzes and predicts but does not build or restructure schedules. And it has no project baseline feature — meaning the original plan and its variance against actuals exist only in external documents, not in the tool itself.
For project managers who are accountable for delivering projects on defined timelines — who need CPM on every plan without a premium surcharge, four dependency types to model real-world work relationships precisely, three resource types to track equipment and materials alongside staff, baselines to explain variance to stakeholders, and AI that actually builds and reschedules plans from natural language — Maverick provides the scheduling discipline that Wrike was not primarily designed to deliver.