The Gantt chart is one of the most powerful tools in project management — and one of the most misunderstood. Used correctly, a well-structured Gantt chart gives your entire team a shared understanding of what needs to happen, in what order, and by when. Used incorrectly, it becomes a static document that nobody trusts.
This guide walks through everything modern project managers need to know about Gantt charts — from basic structure to advanced link relationships, milestone tracking, and AI-assisted rescheduling.
What Is a Gantt Chart?
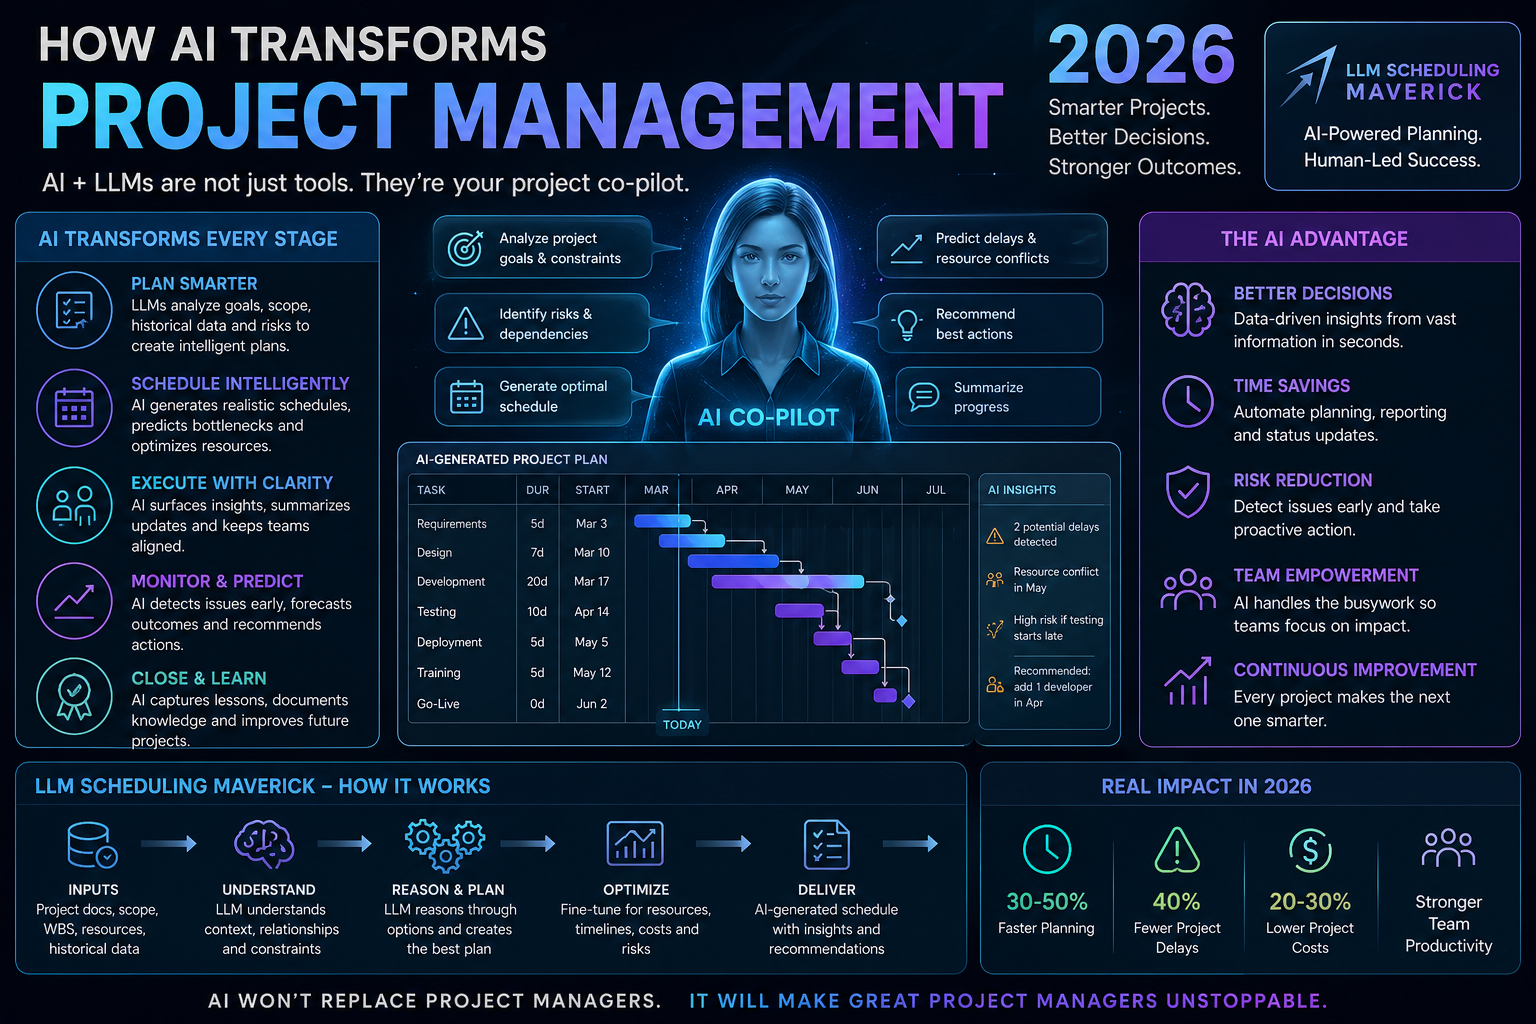
A Gantt chart is a horizontal bar chart that displays project tasks along a timeline. Each task is represented as a bar, with the bar's start and end positions indicating when the task begins and ends. The chart provides an immediate visual overview of the entire project schedule.
Modern Gantt charts go far beyond static bars. In Maverick Project Scheduler, the Gantt chart includes:
- Drag-and-drop task bars for intuitive schedule adjustments
- Link relationship lines showing dependencies between tasks
- Milestone markers indicating key project events or deliverables
- Summary bars that roll up child task durations
- Progress indicators showing completion percentage visually
Understanding Link Relationships
The real power of a Gantt chart emerges when tasks are linked to show dependencies. Maverick Project Scheduler supports all four standard link relationship types:
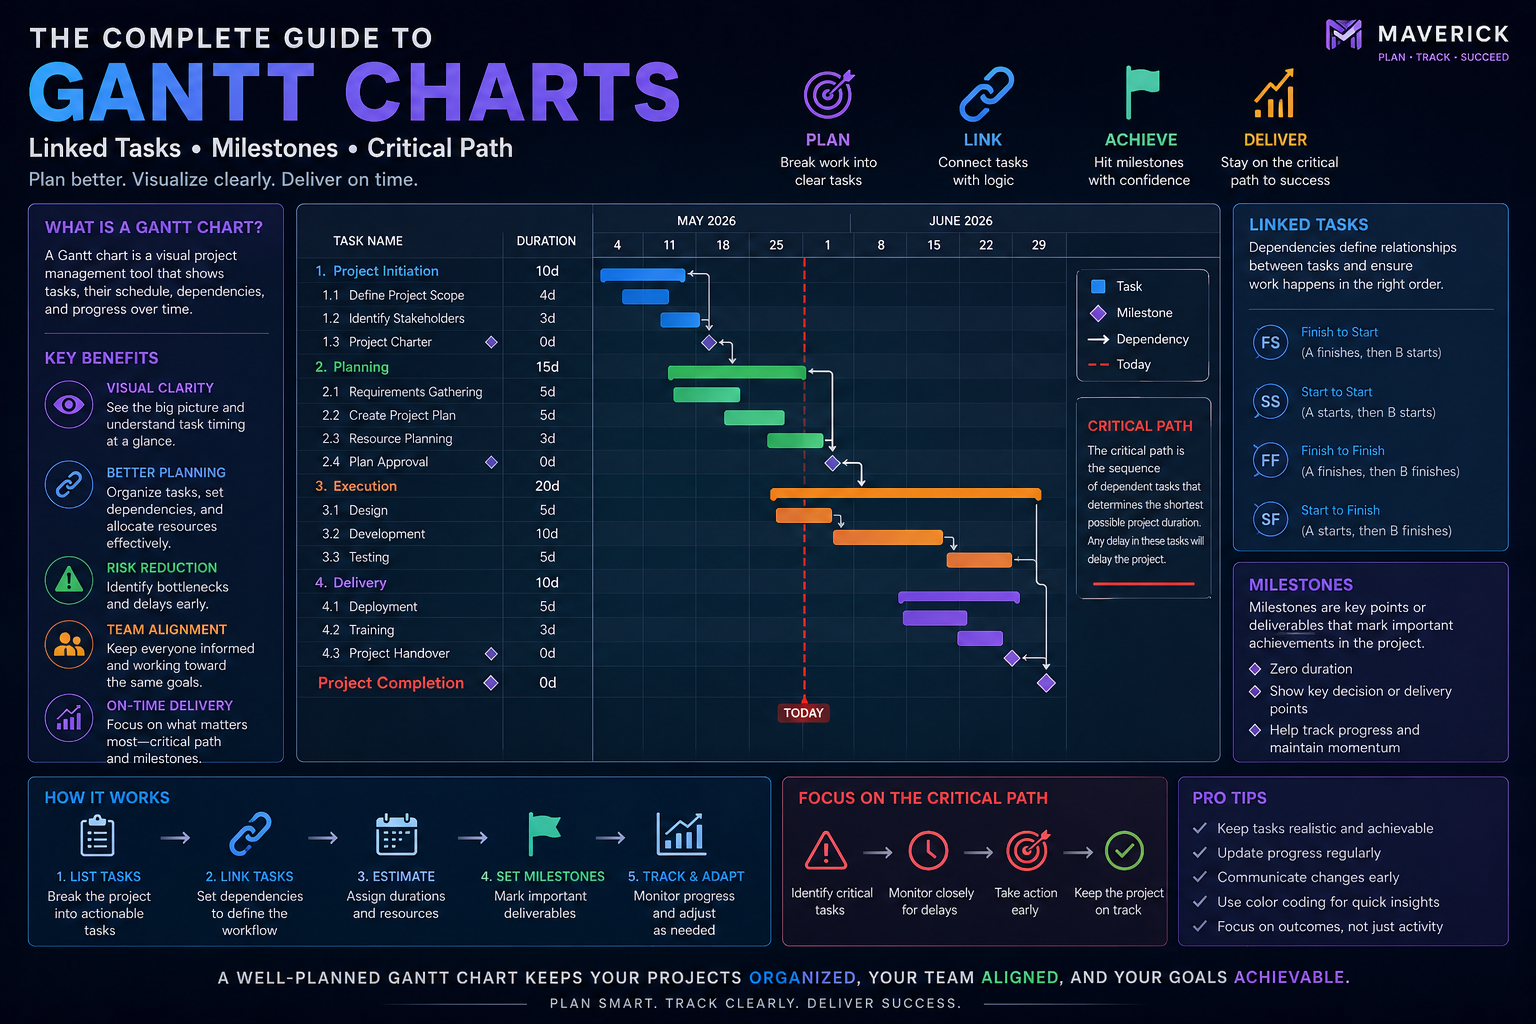
- Finish-to-Start (FS): Task B cannot start until Task A finishes. The most common relationship type — for example, testing cannot begin until development is complete.
- Start-to-Start (SS): Task B cannot start until Task A starts. Useful for parallel work that must begin together — such as two sub-teams starting design phases simultaneously.
- Finish-to-Finish (FF): Task B cannot finish until Task A finishes. Used when two tasks must complete together — like documentation and the feature it describes.
- Start-to-Finish (SF): Task B cannot finish until Task A starts. The least common relationship — often used in just-in-time scheduling scenarios.
Each link can also include lag days — a delay (positive lag) or overlap (negative lag, also called lead) between linked tasks. For example, a two-day lag on an FS link means Task B starts two days after Task A finishes.
Milestones: Marking What Matters
Milestones are zero-duration tasks that mark significant events — a product launch, a phase completion, a client approval, or a contract deadline. In Maverick Project Scheduler, milestones appear as diamond shapes on the Gantt chart, making them immediately distinguishable from regular tasks.
"A well-placed milestone tells your stakeholders exactly where you are in the project lifecycle — without requiring them to read every task."
Best practice: add milestones at the end of each major phase, at any external dependency (deliverables from clients or vendors), and at the final project completion.
Critical Path Analysis
The critical path is the longest sequence of dependent tasks from project start to finish. Any delay on the critical path directly delays the project completion date — there is zero float on these tasks.
Understanding your critical path allows you to:
- Focus management attention where it matters most
- Identify where additional resources could compress the schedule
- Assess the true impact of scope changes on the delivery date
- Communicate risk to stakeholders with data, not gut feel
Drag-and-Drop Rescheduling
Modern Gantt tools like Maverick Project Scheduler allow project managers to reschedule by dragging task bars directly on the chart. When a task is moved, the system automatically recalculates all linked tasks, preserving the established relationships and alerting the PM to any new conflicts.
Combined with AI-assisted rescheduling, Maverick can suggest the optimal way to recover a schedule after a delay — factoring in resource availability, link relationships, and milestone constraints simultaneously.
Summary Bars and Project Hierarchy
Large projects are organized as hierarchies — project portfolios containing projects, projects containing phases, phases containing tasks. In Maverick Project Scheduler, summary bars roll up all child task dates automatically, giving a clean hierarchical view of the project at any level of detail.
Collapsing summary bars lets stakeholders view the high-level timeline without being overwhelmed by task-level detail. Expanding them gives the project manager full granular control.
Build Better Gantt Charts Today
Maverick Project Scheduler includes a fully interactive Gantt chart with drag-and-drop scheduling, all four link relationship types, AI-assisted rescheduling, and unlimited project hierarchy — available free in the cloud trial.
Try the Gantt Chart Free