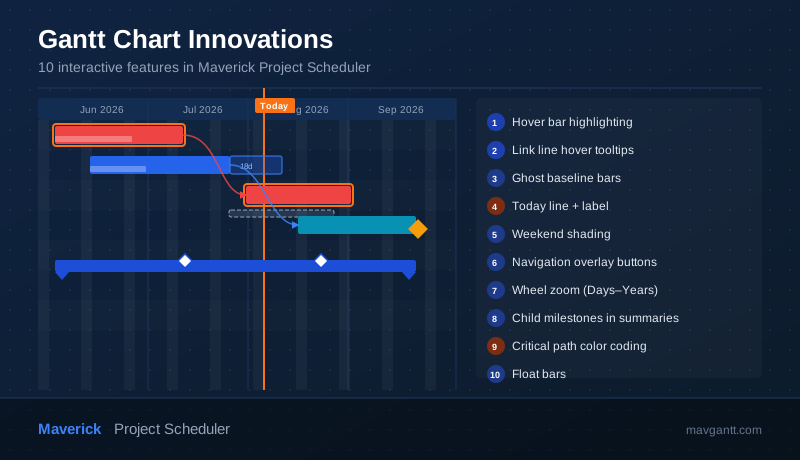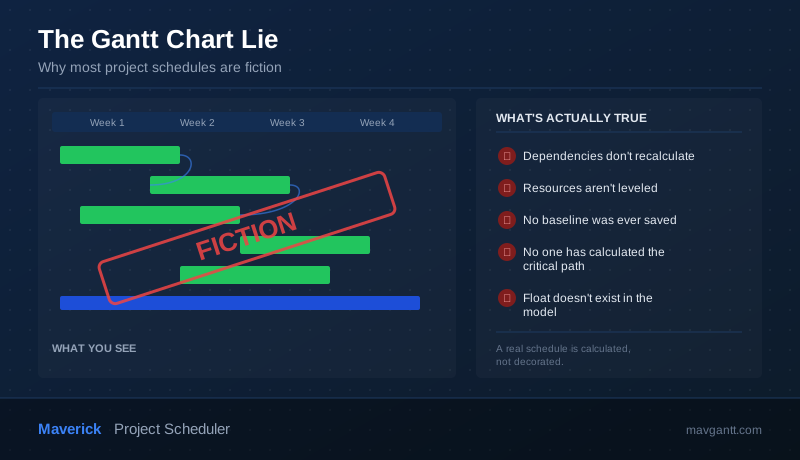
Open the schedule for almost any active project and ask one question out loud: which task, right now, is actually driving the finish date? If the honest answer is "I'm not sure" or "whichever one is red," you are not looking at a schedule. You are looking at a picture of one — bars in the right rows, colors in the right places, dates that look plausible. That is the Gantt chart lie: the chart looks calculated, but nothing underneath it was ever calculated at all.
This is not a knock on any one tool. It is a structural problem with how most project software treats the Gantt chart — as a drawing surface you decorate, rather than an engine you run. And it matters, because every decision made from a fictional schedule — when to hire, when to promise a client a date, when to sound the alarm — is a decision made from a story instead of a fact.
The Difference Between a Schedule and a Drawing
A real schedule is a calculation. You give it durations, dependencies, calendars, and resource availability, and it produces dates — the earliest a task can start, the latest it can finish without delaying the project, and which chain of tasks controls the whole thing. Change one input and the calculation reruns. The dates you see are outputs, not decisions.
A drawing, by contrast, is a set of dates someone typed in or dragged into place. It can look identical to a real schedule — same bars, same arrows, same colors — because nothing forces it to look different. The difference only shows up the moment something changes and the drawing doesn't react the way a calculation would.
The Dependency Illusion
Most schedule tools let you draw an arrow from one task to another. Far fewer actually enforce what that arrow means. Drag the predecessor two weeks later in a genuinely calculated schedule, and the successor — and everything chained after it — moves with it automatically, because the arrow is a constraint the engine respects. In a large number of tools, dragging the predecessor does nothing to the successor at all. The arrow stays on screen, pointing at a task that no longer reflects reality, purely as decoration.
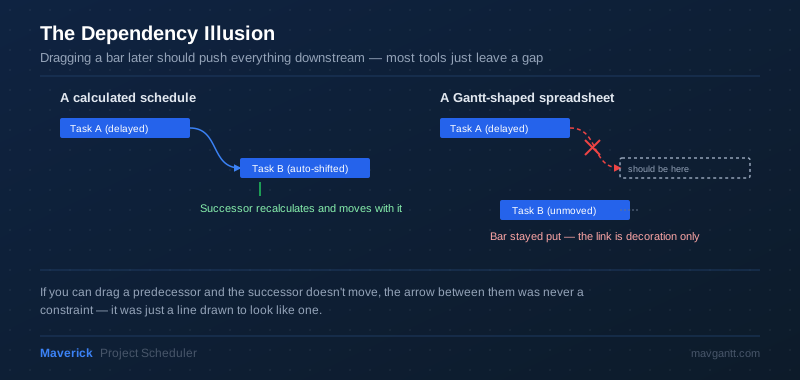
Test it yourself: drag any task bar in your current schedule two weeks to the right. If nothing downstream reacts, every dependency arrow on that chart is a suggestion, not a rule — and every finish date derived from it is a guess dressed up as a plan.
The Resource Blind Spot
A schedule that only shows one project at a time can look flawless while being fundamentally impossible. A person can appear "on schedule" in three separate project views on the same Tuesday, each showing a tidy green bar, while in reality they've been assigned three full days of work inside a single eight-hour day. No individual chart is lying by itself — each one is accurate about that one project. The lie is the assumption baked into all of them: that this person's time is infinite.
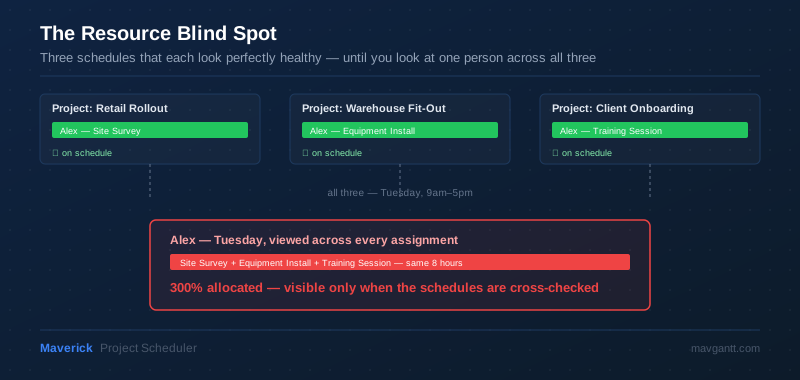
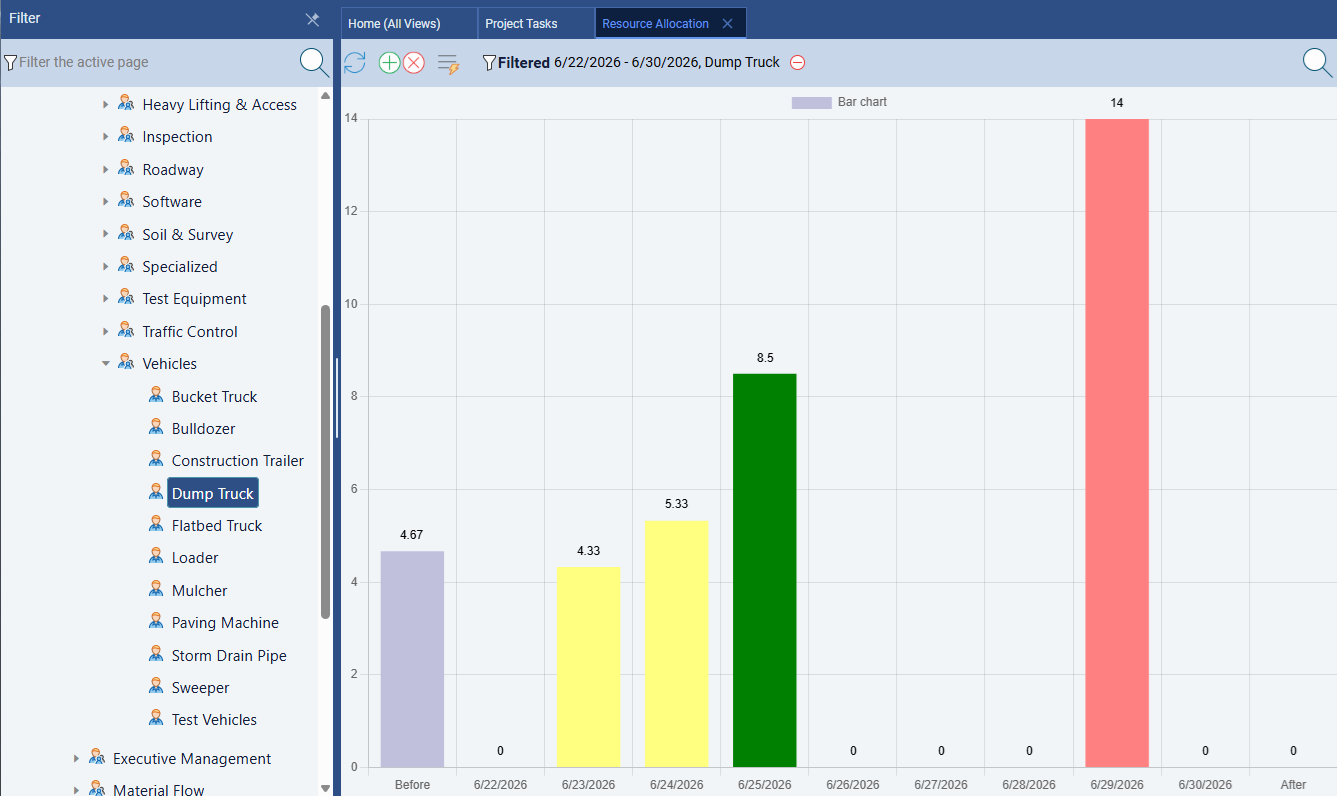
This is what catching the "Alex is 300% allocated" scenario actually looks like: Maverick's resource allocation bar chart color-codes every resource's workload across every project at once — green for correctly allocated, amber for under-allocated, red for over-allocated — so the overcommitment shows up the moment it happens, not three status meetings later.
Resource leveling — actually checking a person's, a machine's, or a material's total commitment across every project they touch — is where most Gantt tools quietly stop calculating and start hoping. Without it, "on schedule" only means "no one has cross-checked this yet."
The Baseline You Never Saved
Ask a project manager if their project is on track and you'll usually get an opinion — a feeling built from memory and the last status meeting. Ask them to prove it and the honest ones will admit there's nothing to compare against. A baseline is a snapshot of the plan taken at one moment in time, kept alongside the live schedule so that "on track" becomes a measurement — this task is three days later than the baseline said it would be — rather than a vibe.
Without a saved baseline, schedule drift is invisible by design. The current dates always look correct, because they've usually been quietly adjusted, task by task, to match reality as it happened rather than the reality that was promised. A schedule with no baseline can't be wrong. It also can't be right. It's just the most recent version of itself.
The Critical Path Nobody Calculated
The critical path is the one number that answers the only question that matters: what is the earliest this project can possibly finish, given everything it depends on? It is not the longest task. It is not the task with the reddest status. It is the longest connected chain of dependent tasks, computed from durations and links — and it changes the moment any input in that chain changes.
Most teams manage risk by watching whichever tasks feel urgent that week. Without an actual critical path calculation, "feels urgent" and "actually drives the finish date" are frequently two different tasks — which means the schedule risk everyone is watching may not be the schedule risk that exists.
A Quick Test for Your Own Schedule
You don't need a consultant to find out which kind of schedule you have. Try this on your current project, right now:
Drag a task's start date two weeks later. If every downstream task shifts automatically, you have a calculation. If nothing moves, you have a drawing. Then ask your scheduling tool — not a person, the tool — which task is on the critical path today. If it can't answer instantly, no one has actually calculated one. Finally, open the baseline comparison. If there isn't one to open, "on track" was never a measurable claim to begin with — it was a mood.
What a Real Schedule Requires
Fixing this isn't about trying harder inside a tool that was never built to calculate. It requires a scheduling engine underneath the chart: dependency links that actually recalculate everything downstream when a date changes, resource leveling across human, machine, and material resources at once — not per project in isolation — a saved baseline to measure drift against, and a true critical path method calculation that names the exact chain of tasks controlling your finish date. Maverick Project Scheduler is built around that engine first and the chart second: four real dependency link types that recalculate on every change, resource allocation across all three resource types, one-click baselines with ghost bars showing exactly how far you've drifted, and a critical path calculation that runs automatically, not on request.
For a fast, checklist-style version of the argument above — the exact signs to look for in your own project today — see 7 Signs Your Gantt Chart Is Lying to You.
See What a Calculated Schedule Actually Looks Like
Maverick recalculates dependencies, levels resources across every project, saves baselines automatically, and runs the critical path in real time — no manual recalculation, ever. Start a free trial and drag a task to see the difference for yourself.
Try Maverick Free