Every project estimate is a prediction. The Maverick timesheet is how you find out how accurate it was. Employees log actual hours worked against specific project tasks — broken down by day across a Monday-through-Sunday week — and the timesheet automatically tallies row and column totals so managers can see where time is going, compare it against planned estimates, and make informed decisions about workload and scheduling going forward.
What the Timesheet Is

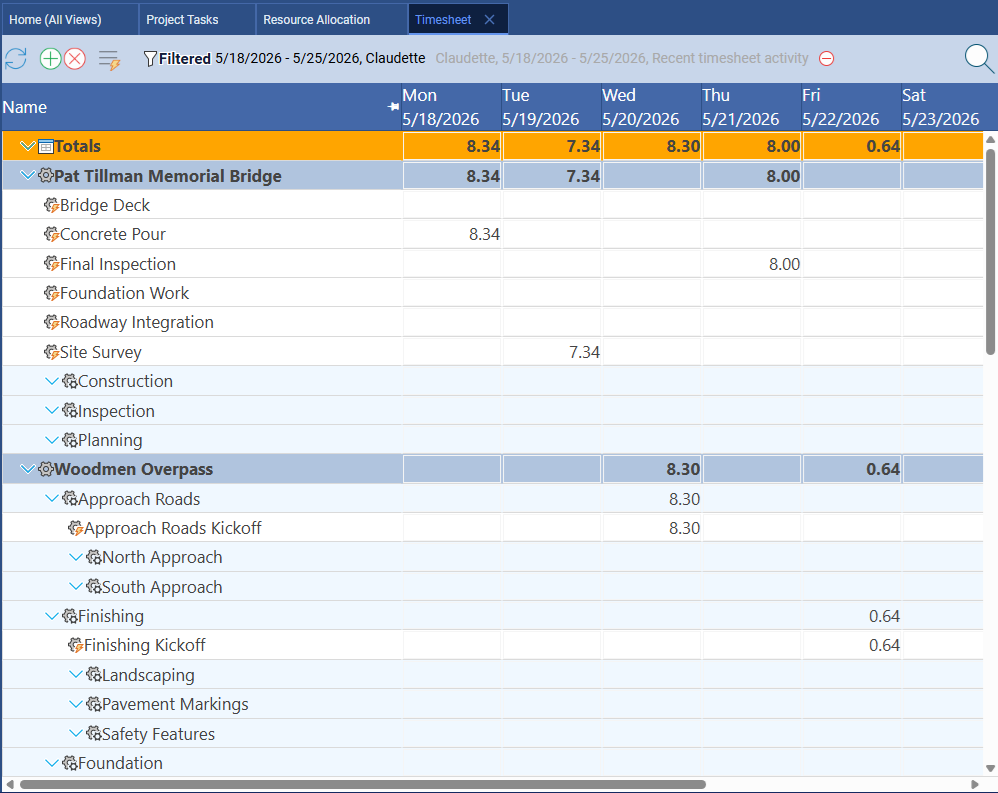
The timesheet is a weekly grid organized by project and task. Each project appears as a collapsible group header, and its tasks appear as editable rows beneath it. Across the top are the seven days of the week — Monday through Sunday — each with an input cell per row where employees enter the hours they worked on that task that day.
Two kinds of totals update automatically as hours are entered:
- Row totals — shown at the right edge of each task row, summing all hours logged against that task for the week
- Column totals — shown at both the top and bottom of the timesheet, summing all hours logged across all tasks for each day of the week
Displaying totals at both the top and bottom means you never have to scroll to check your week's grand total — it's visible whether you're at the beginning of a long list or at the end.
Opening the Timesheet
The timesheet is accessible directly from the Maverick Home page. On the Home page, locate the Timesheet icon and click it. The timesheet opens to the current week by default, showing all projects and tasks that have been assigned to you (or, for administrators and managers, to the selected user).
Because the timesheet lives at the Home page level — not buried inside a specific project — it gives a cross-project view: all of your active tasks from all of your assigned projects appear together in a single weekly grid. This is the practical reality of how most employees work — spread across multiple concurrent projects — and the timesheet reflects that.
Finding Your Project and Task
Projects appear as bold group headers in the timesheet list. Click the arrow beside a project name to expand or collapse its task list. Tasks are shown as indented rows beneath their parent project.
If you have many projects and tasks, use the filter controls at the top of the timesheet to narrow the list. You can filter by project, by task status, by date range, or by user — making it easy to focus on a specific project or look back at a specific pay period.
Entering Hours
Each cell in the Mon–Sun columns is editable. Click a cell in the row for the task you worked on and type the number of hours. Maverick accepts decimal values — enter 7.5 for seven and a half hours, for example. As you tab or click through cells, row and column totals update immediately.
You do not need to enter every day in sequence. Jump to any day, enter hours, and leave the rest blank (blank cells are treated as zero). Most employees fill in their timesheet at the end of each day or at the end of the week, depending on their team's process.
Reviewing Totals — Estimates vs Actuals
The row totals on the right side of the timesheet show actual hours logged per task for the week. These actual hours feed directly into the project's cost accounting. Each project task carries a planned (estimated) hours figure set when the task was created. As actual hours accumulate in the timesheet, Maverick compares them to the estimate — giving project managers a running view of whether work is tracking to plan.
A task where actual hours have already exceeded estimated hours is a signal: either the estimate was too optimistic, scope has grown, or there is a resourcing issue worth investigating. Catching this early — week by week as timesheets come in — is far better than discovering it at project completion.
The daily column totals are useful for a different question: capacity and workload. A day where one employee logs 12 hours across multiple tasks signals overload. A week where several days show only 4 hours logged by a full-time resource suggests under-utilization or unreported time.
Filtering the Timesheet
Managers and administrators can view any employee's timesheet by using the user filter at the top of the timesheet. Select a user from the dropdown and the grid reloads showing only that person's projects and tasks. This is the primary tool for reviewing individual employee time, approving submitted hours, or investigating a cost overrun on a specific project.
The date range filter lets you navigate to any week — not just the current one. Use it to review historical timesheet data, compare this week's hours to last week's, or look back at a completed sprint or billing period.
Additional filters let you narrow the timesheet by project, by task status, or by other criteria. When the timesheet is filtered, only the matching rows are shown — totals recalculate to reflect only the visible rows, so the numbers always match what you see on screen.
The Time Logs Page
The Time Logs page provides an alternative view of the same data. Where the timesheet presents hours in a weekly grid organized by project and task, the Time Logs page presents individual time entries in a flat grid — each row is a single log entry with columns for date, project, task, hours, and any notes attached to the entry.
Like the timesheet, the Time Logs page is accessible from the Home page. It is particularly useful for:
- Auditing — seeing every individual entry in chronological order, including who entered it and when
- Editing or deleting entries — the grid format makes it easy to find and correct a specific entry
- Exporting time data — the grid view is a natural source for payroll, billing, or reporting exports
- Filtering by project — quickly see all time logged against a single project across all employees and all dates
The timesheet and Time Logs views are complementary. The timesheet is where employees enter and review their weekly hours; Time Logs is where managers and accountants work with the resulting data in bulk.
Start Tracking Time Against Your Projects
Sign up for a free cloud trial and put the timesheet to work on a real project. Log actual hours, compare them to estimates, and see exactly where your team's time is going — week by week, task by task.
Access the Free Cloud Trial