Task Properties
Every Project Task Property, Explained
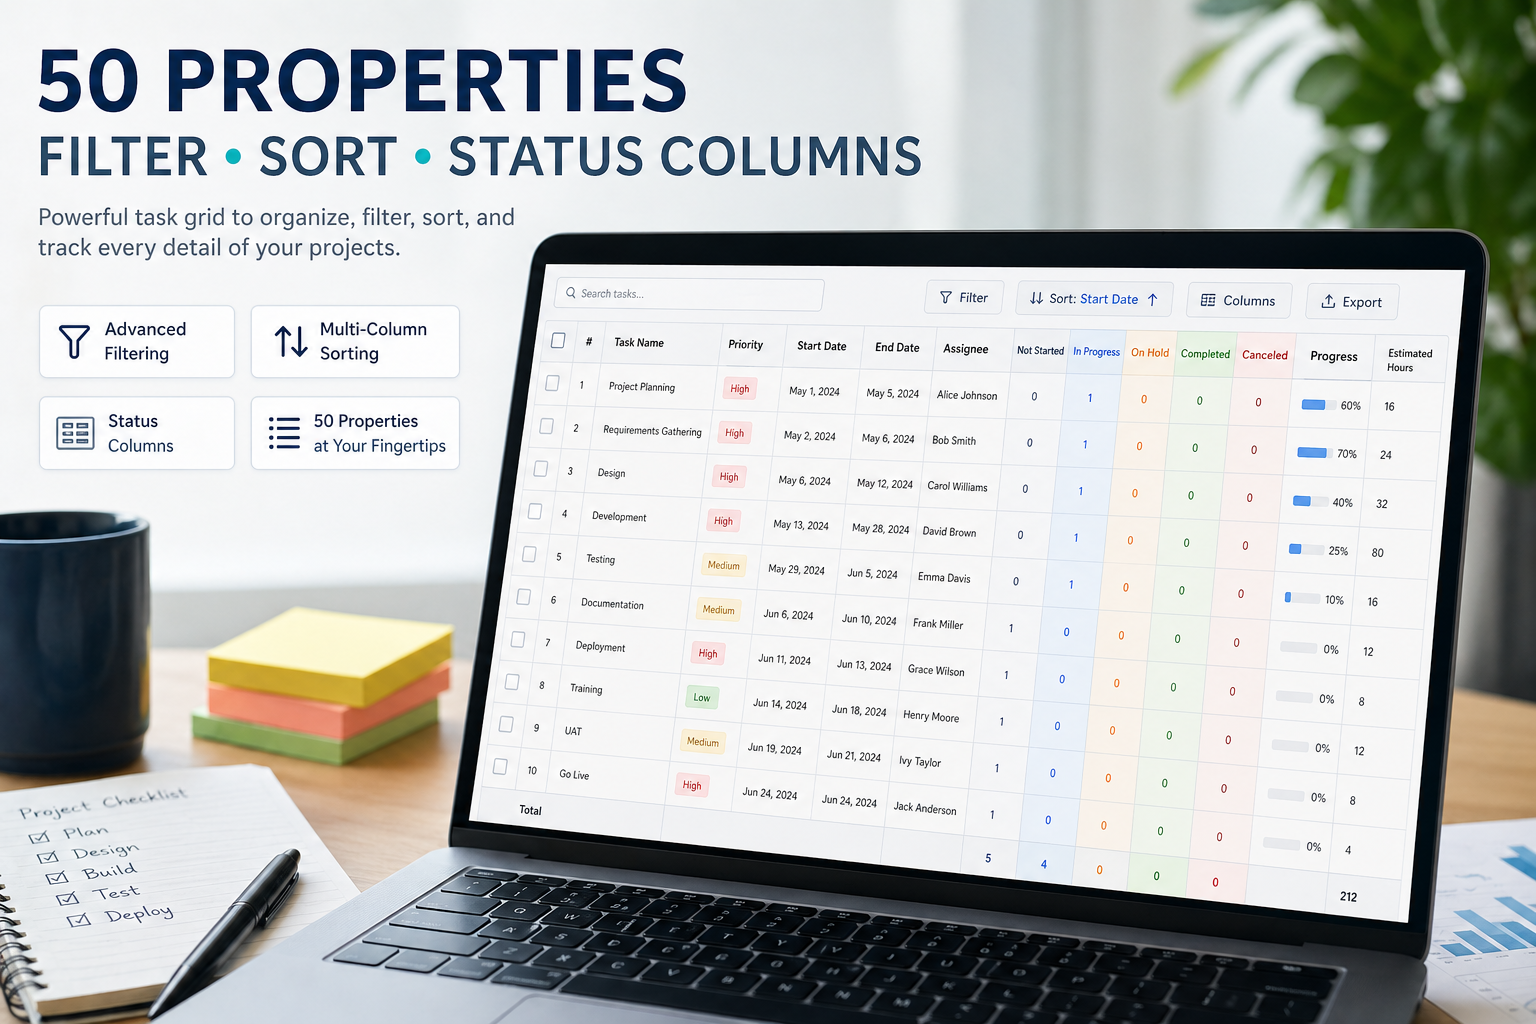
Maverick Project Scheduler tracks over fifty properties on every task — giving you complete visibility into schedules, costs, resources, and progress from a single grid view.
Try It FreeIdentification & Organization
These properties tell you what a task is, where it belongs, and how it fits into the broader project hierarchy.
Name
The task's display name, shown in grids, the Gantt chart, the calendar, resource allocation views, and timesheets. A clear, concise name makes it easy for every team member to identify their work at a glance without having to open the task detail. Good naming conventions here pay dividends when filtering and reporting across hundreds of tasks.
ID
An optional identifier displayed alongside the task name. When projects are imported from Microsoft Project, the ID is filled in automatically to preserve the original numbering scheme. Teams that use work breakdown structures or external tracking systems can populate this field manually to maintain a consistent reference across tools.
Project
The parent project this task belongs to. Every task is associated with exactly one project, which determines how it appears in project-level dashboards, reports, and cost rollups. Linking tasks to projects lets managers instantly filter the entire task grid down to a single initiative and compare progress across a portfolio.
Client
The client associated with this task's project. Maverick uses the client assignment to separate billable hours and costs from internal work, making it straightforward to generate client-facing invoices and profitability reports. When multiple projects serve the same client, the client property ties them together for consolidated billing.
Subproject
The summary task, subproject, or subsystem this task falls under. Subprojects can be nested to any depth, allowing teams to model complex work breakdown structures with phases, modules, or deliverables. Rolling up hours and costs through the subproject hierarchy gives executives a high-level view without losing granular detail.
Category
A general classification of the type of work being performed — such as Design, Development, Testing, or Administration. Categories make it easy to slice reports by work type across many projects simultaneously, helping managers understand where time and budget are actually being spent versus where they were planned.
Dates & Scheduling
Scheduling properties control when tasks begin, when they end, and how Maverick calculates those dates automatically from durations and assignments.
Start
The date work on this task begins. Maverick can calculate the start date automatically based on the finish date, assigned users' availability, or a fixed calendar duration — or you can set it manually. The start date anchors the task on the Gantt chart and drives scheduling calculations for all downstream dependencies.
Finish
The date work on this task is expected to end. Like the start date, the finish can be computed from a start date plus duration, from assigned users' available hours, or set to a fixed date. The finish date is what downstream predecessor tasks wait on before they can begin, making it one of the most critical scheduling properties.
Due
A deadline that can differ from the finish date. The due date represents a commitment to a stakeholder or client, while the finish date reflects the internal schedule. When the finish date slips past the due date, Maverick flags the task so project managers can take corrective action before a deadline is missed.
Calculate Start Date
Determines the method Maverick uses to compute the start date: leave it uncalculated (0), derive it by working backward from the finish date (1), calculate it from a calendar-based duration (2), or set it from the assigned users' earliest available time (3). Choosing the right method ensures the schedule stays realistic as assignments and durations change.
Calculate Finish Date
Controls how the finish date is computed: from the start date plus duration (0), from a calendar duration (1), left uncalculated (2), or derived from when assigned users will finish their hours (3). This flexibility lets teams mix fixed-date milestones with effort-driven tasks in the same project without manual recalculation.
Calculate Due Date
Specifies whether the due date is managed independently (0) or automatically kept in sync with the finish date (1). Linking the due date to the finish date is useful for internal tasks where the deadline and planned completion are the same. Decoupling them is essential when commitments to clients are fixed regardless of schedule shifts.
Calendar Days
The total number of elapsed calendar days the task occupies on the timeline, from start to finish. This differs from duration in hours because it includes weekends, holidays, and non-working time. Calendar days are particularly useful for milestone tracking and for communicating timelines to stakeholders who think in weeks and months rather than work hours.
Duration
The planned number of work hours required to complete this task. Duration is the foundation of effort estimation and cost forecasting — multiply it by the salary rate and you have your baseline labor cost. As actual hours are logged, the system compares them against duration to compute percent complete and flag tasks that are running over budget.
Order
A numeric value that controls the display sequence of tasks in grids and determines the order in which tasks are executed within a project. Setting the order explicitly lets managers lay out the work sequence before start and finish dates are finalized, and ensures that printed reports and exported files present tasks in a logical, readable progression.
Status & Progress
Progress properties give managers a real-time picture of where each task stands and automatically alert the team when work is falling behind.
Status
The current state of the task, drawn from a customizable list of values your organization defines — such as Not Started, In Progress, On Hold, or Complete. Status is the most human-readable progress indicator and drives dashboard filters, letting managers quickly surface everything that is blocked or waiting for action without wading through the full task list.
Priority
A user-defined ranking of task urgency. Priority values can be letters (A, B, C), numbers (1, 2, 3), or any custom scheme your team prefers. When resources are stretched thin, sorting the task grid by priority ensures that the most important work gets attention first — a simple but powerful tool for managing competing demands across a portfolio.
% Complete
The percentage of the task that has been finished, calculated automatically as remaining hours divided by total duration. This single number communicates progress clearly to stakeholders who do not need to see the raw hour counts. Tracking percent complete across all tasks in a project gives the project-level completion percentage used in executive dashboards.
% Status
A color-coded visual progress bar that displays percent complete at a glance in grids and dashboards. Rather than reading a number, users see a filled bar that immediately communicates health — green for on track, yellow for caution, red for overdue. This property is especially effective in summary views where managers are scanning dozens of tasks quickly.
Completed
A simple yes/no flag that marks a task as done. When a task is marked complete, Maverick displays it with gray strikethrough text in grids, making it visually distinct from active work. Completed tasks are still searchable and reportable, preserving the project's history while keeping the active task list clean and focused.
Task % Warning
The percent-complete threshold at which Maverick displays a warning indicator on the task. For example, setting this to 80% alerts the team when a task is nearing completion so they can verify quality, line up the next dependency, or flag any final blockers. Early warnings prevent the last 20% of a task from quietly stalling while everyone assumes it is almost done.
Task % Error
The percent-complete level at which Maverick stops accepting new time entries on this task. Setting an error threshold — often 100% or slightly above — prevents accidental over-logging after a task is finished. This acts as a hard stop to keep actual hours data clean and ensures that any additional work gets opened as a new task with proper authorization.
Actual Work
The total number of hours that have been logged against this task to date. Actual work accumulates from timesheet entries and is compared against duration to compute percent complete and remaining hours. Watching actual work grow relative to duration is the most reliable early warning system for tasks that are consuming more effort than planned.
Remaining
The number of hours still required to complete the task, calculated as duration minus actual work. Remaining hours drive forecast-to-complete calculations and feed the resource allocation chart, allowing managers to see future workload rather than just past performance. When remaining hours are updated by the assignee, the schedule automatically adjusts to reflect the new projected finish date.
Production Quantities
Quantity properties track how many items or units a task is expected to produce and how many have actually been completed.
Qty
The total number of units, items, or deliverables this task is expected to produce when the project is fully executed. Quantity is useful for manufacturing, construction, and product development projects where progress is measured in physical output as well as hours. It gives stakeholders a production-based view of progress alongside the time-based percent complete.
Qty Built
The number of units or items actually completed at this point in time. Comparing qty built against qty reveals the production gap — how much more needs to be made to fulfill the deliverable. For manufacturing and fabrication tasks, this is often more meaningful than percent complete because it directly ties project progress to tangible output that can be verified on the floor.
Resources & Assignments
Assignment properties control who or what is working on each task and at what level of effort, enabling accurate workload balancing and cost forecasting.
Users
The people, machines, and materials assigned to perform this task. Maverick supports multiple assignees per task, making it possible to model team efforts, shared equipment, and consumed materials in a single record. Assignments feed the resource allocation chart, giving managers a visual picture of who is over-committed and who has capacity before the overload becomes a problem.
Assign Percent
The percentage of each assigned resource's available time dedicated to this task. A 50% assignment means the resource spends half their working hours here and the other half elsewhere. Assign percent drives scheduling accuracy — Maverick uses it to calculate how long a task will take given each resource's availability, rather than assuming they are working on it full time.
Assign Hours
The specific number of hours allocated to each resource on this task, as an alternative to using a percentage. When a resource has a fixed cap — for example, a contractor available for exactly 20 hours — assigning hours directly is more precise than a percentage. Maverick uses this value to compute costs and to determine when the resource's contribution to the task is exhausted.
Actual Work by User
A breakdown of actual hours logged by each individual resource assigned to the task. While the overall actual work property shows total hours, actual work by user reveals how the effort was distributed — whether the task ran on one person pulling extra hours or the whole team contributing equally. This level of detail is essential for individual performance reviews and precise billing by resource.
Resources
Additional resource information imported from Microsoft Project. When a project plan is brought in from MS Project, this field carries over resource names exactly as they appear in the source file, preserving compatibility with the original plan. Teams that move between Maverick and MS Project use this field to keep resource data synchronized across both environments.
Skills
The skills or competencies required to perform this task, used when Maverick's AI performs resource leveling by skill. Rather than assigning a specific person, you can specify that a task needs a structural engineer or a senior front-end developer and let Maverick find the best-available qualified resource. This is especially valuable in large organizations where capability is distributed across many teams.
Task Dependencies
Dependency properties link tasks together so that a change to one task's schedule automatically propagates to every task that depends on it.
Predecessors
The tasks that must finish before this task can begin. Setting predecessors creates a dependency chain that Maverick uses to calculate schedule cascades — if a predecessor slips by a week, Maverick automatically pushes out every downstream task's start date accordingly. Predecessors are the backbone of critical-path analysis, showing managers exactly which delays have the power to move the project end date.
Predecessor links support four relationship types — FS, FF, SS, and SF — and can include lag or lead time offsets. Task Link Relationships Explained
Successors
The tasks that are blocked until this task completes. Successors are the mirror of predecessors — where predecessors show what this task is waiting on, successors show who is waiting on this task. When a task is at risk of running late, reviewing its successors immediately tells a manager how far the ripple effect will reach and which downstream deliverables are in jeopardy.
Each successor inherits a link type (FS, FF, SS, or SF) and optional lag. Task Link Relationships Explained
Cost & Billing
Financial properties give every task a complete cost picture — from initial estimates and client quotes to actuals and remaining exposure — so nothing is left to a spreadsheet.
Billable
A yes/no flag that determines whether hours logged to this task are charged to the client. Setting tasks as non-billable — for internal meetings, rework, or overhead — keeps client invoices accurate and prevents inadvertent billing for work the contract does not cover. Reports filtered by billable status let managers see exactly how much client-billable effort the team is generating versus internal overhead.
Salary Rate
The hourly rate paid to human resources working on this task. Maverick multiplies the salary rate by hours worked to calculate labor costs, giving finance teams accurate cost data without requiring a separate payroll export. Different resources can carry different salary rates on the same task, reflecting the real-world cost structure of a blended team.
Client Rate
The hourly rate charged to the client for work performed on this task. The difference between the client rate and the salary rate is the gross margin on every hour — tracking both side by side lets project managers instantly see whether a task is profitable. When client rates are negotiated per task or per resource type, this property captures those distinctions precisely.
Cost Salary (Est.)
The total estimated salary cost for this task, computed by multiplying duration by the salary rate across all assigned resources. This is the planned labor expense before any work has begun, used in project budgeting and bid preparation. Comparing it against the actual salary cost at any point in the project reveals whether labor is tracking to budget.
Cost Client (Est.)
The total revenue expected from the client for this task, calculated from duration and the client rate. Estimated client cost is the planned top-line revenue on the task and is essential for profitability analysis. Summing estimated client cost across all tasks in a project gives the contract value that can be compared against the actual invoiced amount at completion.
Cost Salary Actual
The total salary dollars actually paid to resources for work completed on this task so far. As time is logged, Maverick multiplies actual hours by each resource's salary rate and accumulates the result here. Watching actual salary cost grow relative to the estimate is the clearest signal that a task is going over labor budget before it is too late to act.
Cost Client Actual
The revenue actually earned from the client based on billable hours logged to date. This is the real earned value of the work — what the client owes for the work completed so far. Comparing cost client actual against cost salary actual gives the realized margin at any point in the project lifecycle, not just at the end.
Cost Salary Remaining
The labor cost still expected to be incurred to finish this task, calculated from remaining hours and the salary rate. Cost salary remaining is a forward-looking metric — it tells finance how much more payroll commitment is ahead. Adding it to cost salary actual gives the total forecast-to-complete labor expense, which can be compared against the original estimate to flag budget overruns early.
Cost Client Remaining
The client revenue still to be earned on this task based on remaining billable hours. This is the unbilled portion of the task's value — the amount the client will owe when the remaining work is delivered. Tracking cost client remaining helps account teams manage cash flow forecasting and ensures no earned revenue slips through the cracks at project closeout.
Quoted Duration
The number of hours quoted to the client for this task during the proposal or scoping phase. Storing the original quote separately from the actual duration preserves the baseline commitment so you can always see how much scope has drifted. When actual duration exceeds quoted duration significantly, it is a trigger for a change order conversation rather than silent cost absorption.
Quoted Cost
The dollar amount quoted to the client for this task. Quoted cost is the fixed-price commitment in a statement of work or proposal, independent of how many hours it actually takes to deliver. Comparing quoted cost against cost client actual at any point shows whether the task is being delivered within the agreed price — critical intelligence for fixed-bid engagements.
Material Cost (Est.)
The estimated cost of materials, supplies, or equipment needed to complete this task. Material costs are separate from labor costs and must be budgeted independently for accurate project financials. Capturing the estimate upfront allows procurement teams to source materials early and gives finance a complete picture of the total task cost beyond just hours.
Material Cost (Actual)
The actual material expenses incurred so far while performing this task. As purchases are made, this value is updated so that total task cost — labor plus materials — is always current. Comparing material cost actual against the estimate surfaces procurement overruns while work is still in progress, allowing teams to renegotiate with suppliers or adjust scope before the budget is exhausted.
Customization & Administration
These properties adapt Maverick to your organization's specific workflow, appearance preferences, and governance requirements.
Timesheet
A yes/no control that determines whether this task appears in the employee timesheet view. Not every task should be time-logged by every team member — hiding administrative or summary tasks from the timesheet keeps the daily logging experience clean and reduces entry errors. Only tasks relevant to a resource's direct work need to appear in their timesheet queue.
Pay Type
Specifies whether hours logged to this task are paid at the normal rate or the overtime rate. When employees work beyond standard hours on critical tasks, pay type ensures those hours are recorded correctly for payroll processing. It also feeds cost calculations accurately — overtime work at 1.5x the salary rate has a real impact on task financials that must be captured, not estimated.
Text 1
A freeform text field available for any purpose your team defines — notes, external reference numbers, approval codes, vendor names, or custom data that does not fit another field. Text fields can also be read by scripts running against the task, enabling dynamic behavior based on values you define. What goes here is entirely up to your organization's workflow needs.
Text 2
A second freeform text field, independent of Text 1, for capturing a second category of custom information. Having multiple text fields means you can tag tasks with more than one custom attribute simultaneously — for example, Text 1 for the work order number and Text 2 for the vendor contact — without mixing unrelated data into a single field.
Text 3
A third freeform text field providing even more flexibility for organizations with complex tagging or classification needs. Three independent text fields give teams the room to capture custom metadata that drives filtering, reporting, and scripting logic specific to their industry or process, without requiring a system administrator to add custom database columns.
Color
The background color displayed for this task in grids and the calendar view. Color coding is a powerful at-a-glance communication tool — teams commonly use it to distinguish departments, priority levels, or task types without reading a single word. A well-designed color scheme lets a manager scan a full project timeline and instantly understand its structure.
Can Log Time Script
A script — written in SQL, JavaScript, or C# — that Maverick executes before allowing any time to be logged to this task. The script can enforce business rules such as requiring a purchase order number, checking whether a prerequisite task is complete, or validating that the resource is certified for this type of work. If the script returns a failure, the time entry is blocked and the user sees the error message the script provides.
Attachments
Images, documents, drawings, specifications, or any other files attached directly to the task. Keeping attachments on the task rather than in a separate document system means the relevant files are always where the work is — no hunting through shared drives or email threads. Attachments are visible to everyone with access to the task and travel with it through the project lifecycle.
History
A complete audit trail of every change made to this task — who changed what, and when. History answers the questions that arise during project reviews and client disputes: when was the due date moved? Who changed the status? What was the original duration estimate? A full change history promotes accountability and gives project managers the evidence they need to understand how a project evolved over time.