
A Gantt chart is the oldest and most trusted view in project management. It maps every task in a project to a horizontal bar on a shared timeline, letting you see the entire schedule at a glance — what starts when, how long each piece of work takes, which tasks depend on others, and how the whole project unfolds from kickoff to completion. Maverick Project Scheduler puts a full-featured interactive Gantt chart at the center of every project, giving your team a live view of the schedule that updates in real time as work progresses and plans change.
What Is a Gantt Chart?
A Gantt chart (pronounced "GANT") is a type of bar chart used to plan, schedule, and monitor projects. It was developed by mechanical engineer Henry Gantt in the early 1900s and has been the dominant visual tool in project management ever since — for good reason. It solves one of the hardest problems in project planning: communicating a complex, interdependent schedule to a mixed audience of team members, managers, and stakeholders who need to understand it quickly and accurately.
The chart works by plotting two things against each other:
- Tasks (or activities) on the vertical axis, listed from top to bottom in the order they'll be worked on
- Time on the horizontal axis, running left to right from the project's start to its end
Each task gets a horizontal bar. The bar starts at the task's start date and ends at the task's finish date — so its length represents how long the work takes. A bar that spans three columns on a weekly time scale means a three-week task. A bar that spans one column means a one-week task. At a glance, the visual weight of the chart tells you where the work is concentrated, where the project is heavy, and where it's sparse.
Unlike a spreadsheet of start and end dates, a Gantt chart is immediately readable by anyone. A new team member can look at a project's Gantt chart and understand the project's shape in seconds — no training required, no legend needed. That readability is why Gantt charts have survived a hundred years of new project management tools: they communicate schedule information faster than any other format.
Reading a Gantt Chart

A Gantt chart has a small vocabulary of visual elements. Once you can read them, any Gantt — in Maverick or anywhere else — becomes immediately interpretable.
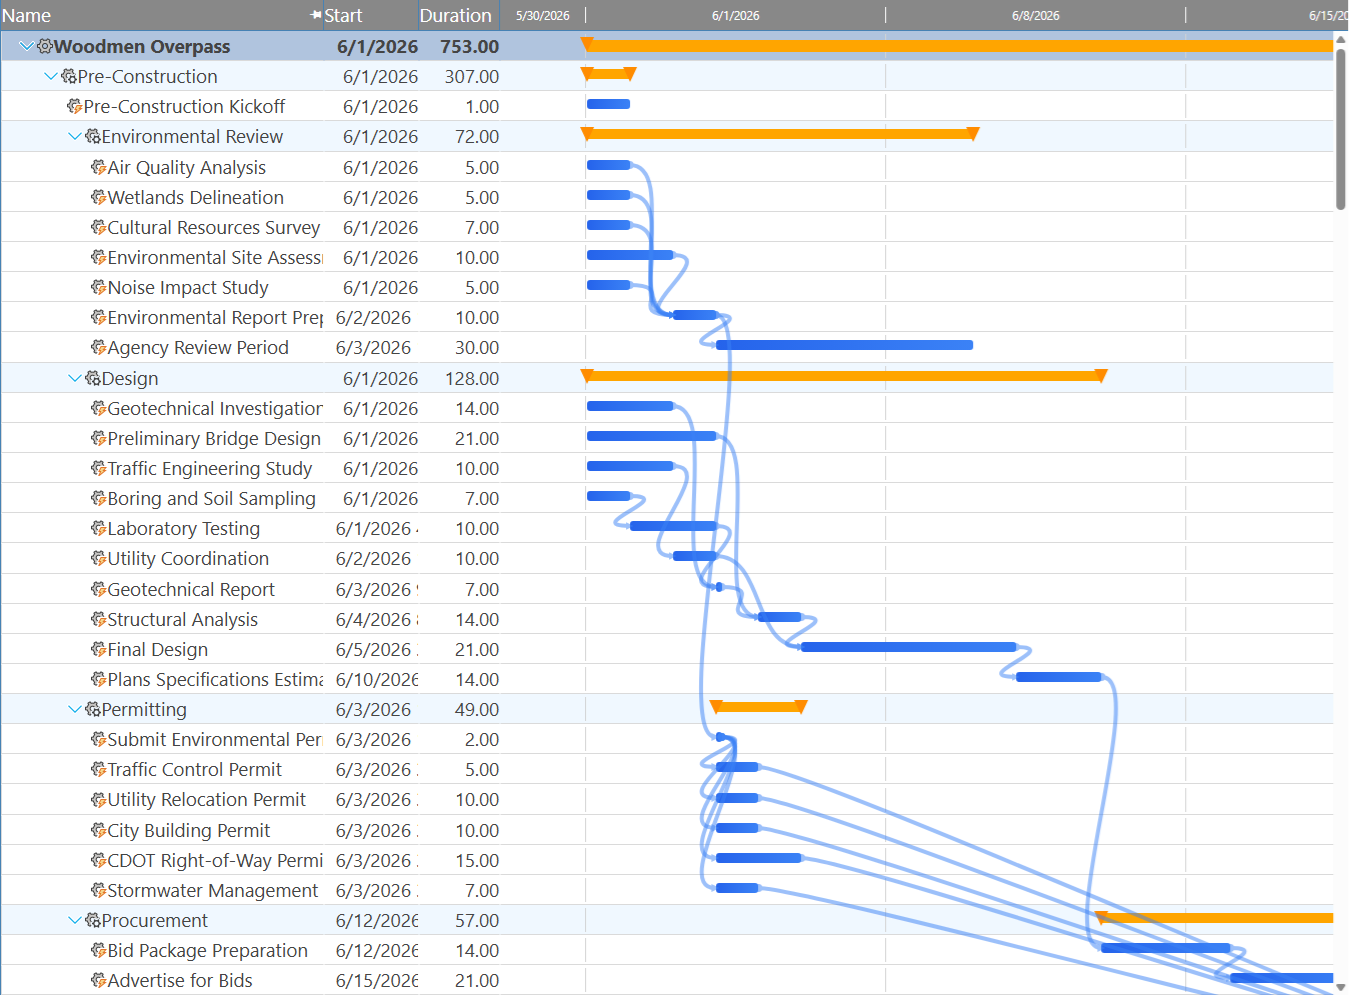
The task list runs down the left side. This is the work breakdown structure of the project: individual work items, grouped and indented under summary rows that represent phases, stages, or deliverables. Reading down the task list tells you everything the project involves; reading left to right across any row tells you when that work happens and how long it takes.
Summary rows (also called phase bars or parent tasks) are collapsed views of a group of tasks. Their bar spans from the earliest start date to the latest finish date of all the child tasks nested beneath them. In the Gantt, summary bars are typically drawn in a thicker, darker, or bracket-shaped style to distinguish them from ordinary task bars. When you collapse a summary row, all the detail underneath disappears and only the phase bar remains — useful for executive-level views where you want to show the shape of the project without the line-by-line detail.
Task bars are the horizontal bars in the Gantt area. Each bar is positioned on the timeline between a task's start and finish date. A wider bar means a longer task; a shorter bar means a quicker one. Task bars can be color-coded to indicate status, phase, resource, or priority — in Maverick, the default coloring follows the project's schedule status, with tasks that are behind schedule visually distinct from those on track.
Milestones appear as diamond shapes on the timeline rather than bars. A milestone has no duration — it marks a single point in time: a deadline, a review gate, a client delivery, or a decision point. When a project's milestones are clearly visible in the Gantt, stakeholders can see at a glance whether the project is on track to hit each critical date. A milestone that's drifting to the right relative to its planned position is a clear signal that something upstream has slipped.
Dependency arrows connect the end of one task bar to the start of the next. They show that one task must finish before the next can begin. Following the chain of arrows from left to right traces the logical sequence of the project. A Gantt without dependency arrows is a chart of bars; a Gantt with dependency arrows is a model of how the work actually flows.
Building a Project Schedule in the Gantt
Before any bars appear, you need tasks. In Maverick, adding tasks to the Gantt is as simple as entering a task name, setting a start date, and entering a duration. The Gantt bar appears immediately and positions itself correctly on the timeline. Change the duration and the bar stretches or shrinks. Change the start date and the bar slides left or right.
For most projects, tasks are organized into a work breakdown structure (WBS): a hierarchy where broad phases contain specific tasks. In Maverick, you build this hierarchy by indenting tasks under parent summary rows. The indentation creates a tree of work that rolls up visually in the Gantt, with summary bars spanning the full duration of everything nested beneath them. A project with clear phase structure in the WBS produces a Gantt that communicates naturally: zoom out to the phase level for the big picture, drill down to individual tasks for the detail.
Milestones are added the same way as tasks but with zero duration or a milestone flag. Use them to mark client deliverables, phase gates, external dependencies, regulatory approvals, or any date the project absolutely must hit. A project calendar without milestones is a schedule; a project calendar with milestones is a commitment.
Maverick also lets you set constraints on individual tasks — "Start No Earlier Than," "Finish No Later Than," "Must Start On," and others. Constraints are rules you attach to a task to anchor it to a specific position in the timeline regardless of what dependencies say. Use them when an external factor — a vendor delivery date, a regulatory deadline, a seasonal window — dictates exactly when a task must happen. Use them sparingly, though: too many hard constraints make a schedule brittle and difficult to update when reality diverges from the plan.
Task Dependencies: The Logic Behind the Schedule

Dependencies are the rules that define which tasks must happen before other tasks can start. Without dependencies, your Gantt chart is just a collection of colored bars — each task is a standalone island with no logical connection to anything else. With dependencies, the chart becomes a model of how the work actually flows, and changes to one part of the schedule automatically cascade to everything downstream.
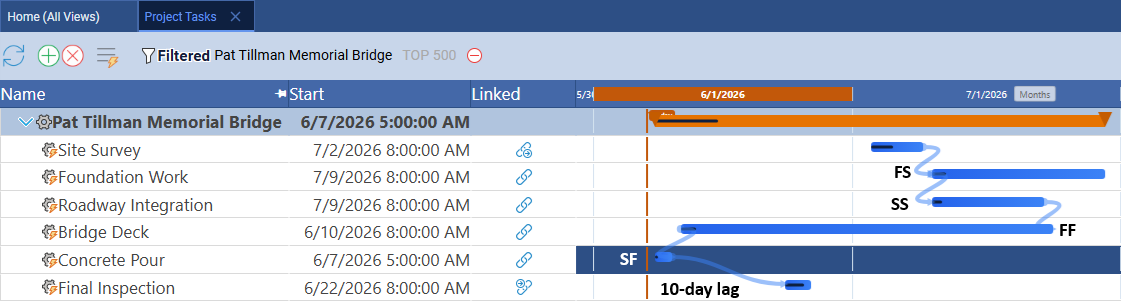
The most common dependency type is Finish-to-Start (FS): Task B cannot begin until Task A is finished. This is the natural sequence for most project work. You can't test software you haven't written. You can't paint walls you haven't plastered. You can't install a roof on a frame that isn't up. Finish-to-Start dependencies are the backbone of most project schedules.
Maverick supports three additional dependency types for situations where work overlaps or runs in parallel:
- Start-to-Start (SS): Task B cannot start until Task A has started. Useful when two activities can happen in parallel but one must lead the other — detailed design and prototyping might start together, but the prototyping team can't begin before design kicks off.
- Finish-to-Finish (FF): Task B cannot finish until Task A has finished. Useful when two tasks are tracked separately but must wrap up at the same time — user acceptance testing and documentation might both need to be complete before a release, but they run concurrently.
- Start-to-Finish (SF): Task B cannot finish until Task A has started. Rare in practice, but used in shift handoffs and just-in-time scheduling where one activity must be underway before another can be signed off.
Lag time adds a gap between two dependent tasks — a two-day lag between "Pour Foundation" and "Frame Walls" represents the curing time before the next crew can start. Lead time (entered as negative lag) overlaps tasks — allowing testing to begin three days before development is completely finished, because the first modules are ready even if the last aren't.
When you add or change a dependency in Maverick, the Gantt chart updates immediately. Tasks shift forward or backward on the timeline to respect the new logic, and the effect cascades downstream through the entire dependency chain. If a single change pushes the project end date by a week, you see it the moment you make the change — not later, when it's harder to address.
Task Link Relationships in Maverick
The Critical Path

The critical path is the longest chain of dependent tasks that runs from the project's start to its finish. Every task on the critical path has zero float — it cannot be delayed by even one day without pushing back the project's end date. This is one of the most important concepts in project management, and the Gantt chart is the natural place to see it.
Here's what makes the critical path so useful: on any real project, not all delays are equal. If a non-critical task slips three days, the project may absorb that slip entirely with no impact on the finish date. But if a critical task slips three days, the project finishes three days late. Knowing which tasks are critical tells you where to focus your attention, your best people, and your risk management efforts.
In Maverick, the critical path is highlighted directly in the Gantt chart. Critical tasks appear in a distinct color — typically red or orange — so they stand out from the rest of the schedule at a glance. As you make changes to the schedule — adjusting durations, adding resources, reordering tasks — the critical path recalculates automatically. A task that was non-critical can become critical if a change reduces its float to zero; a task that was critical can become non-critical if something upstream is accelerated.
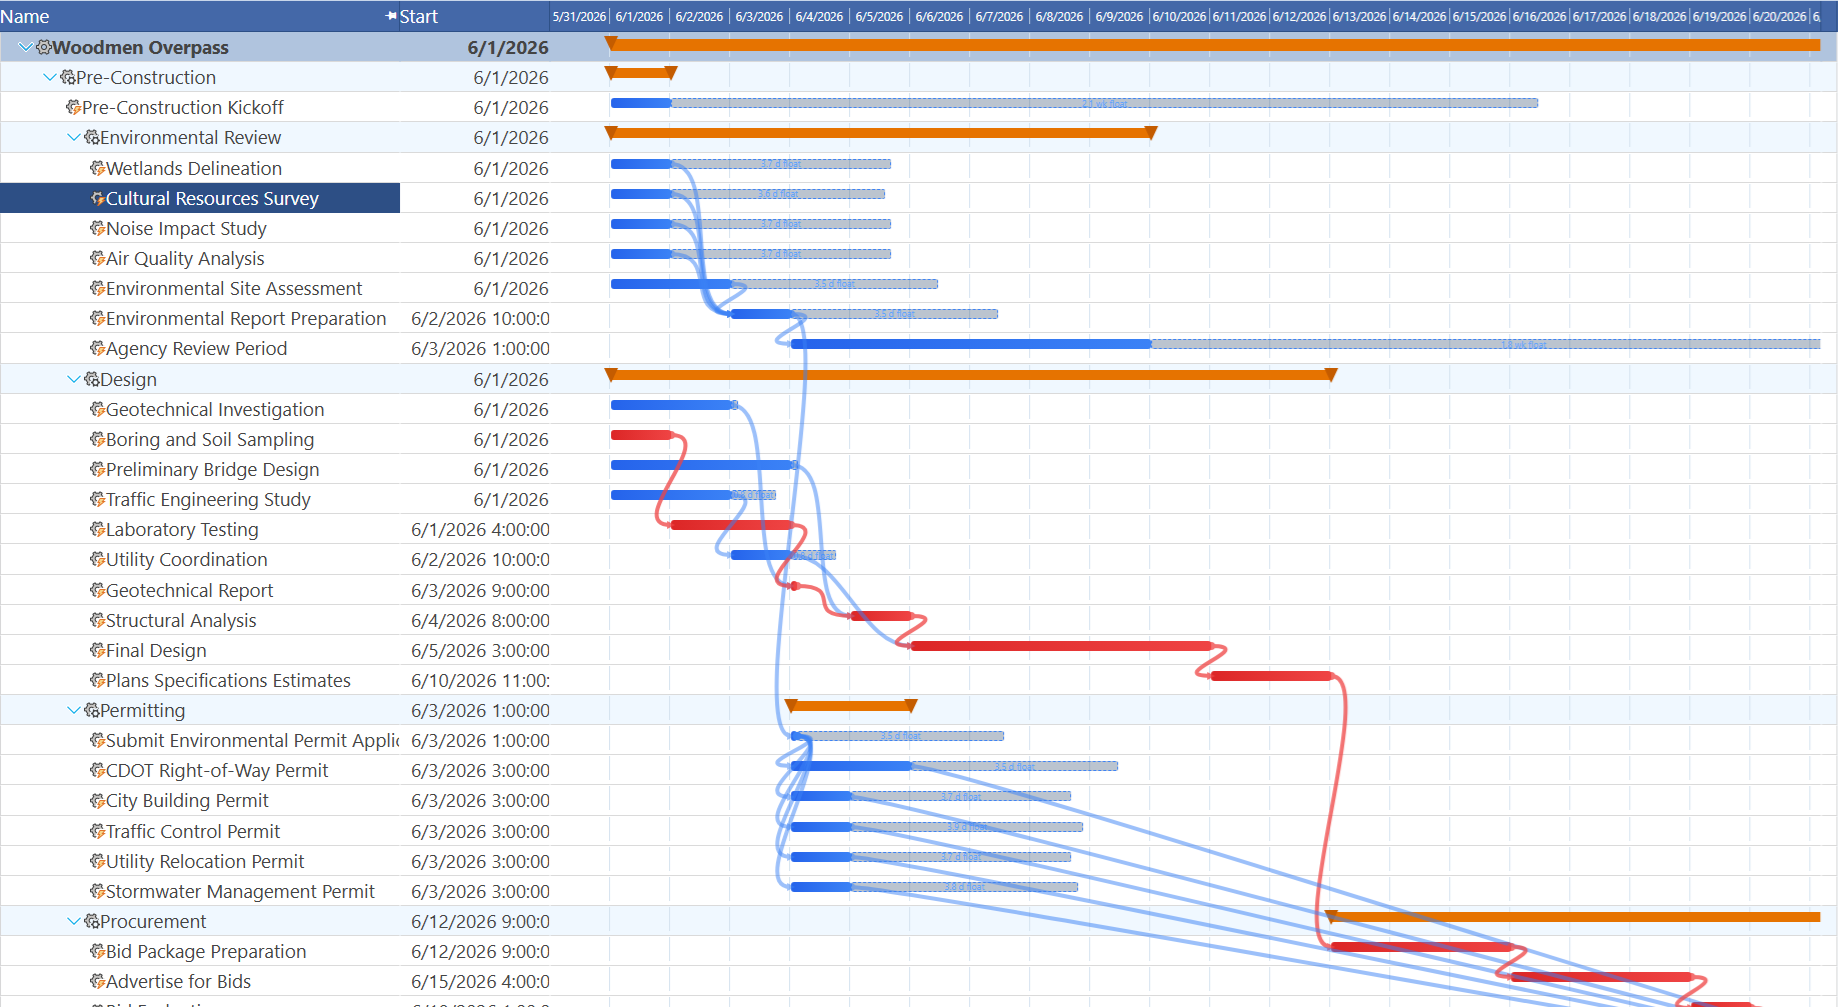
Float (also called slack) is the amount of time a non-critical task can slip before it joins the critical path. A task with 10 days of float has plenty of breathing room; a task with 2 days of float should be watched closely. Maverick displays float for every task in the schedule, giving you a complete picture of where your schedule has flexibility and where it's vulnerable.
Maverick makes float visible directly in the Gantt: each non-critical task bar is followed by a translucent float bar extending to the right, labeled with the available slack in days or weeks — "3 d float" or "1.4 wk float". You can see at a glance which tasks have a comfortable buffer and which are a day away from becoming critical. Dependency arrows between two consecutive critical tasks are drawn in red rather than blue, so you can trace the entire critical chain visually from the first task to the last.
When a stakeholder asks for a schedule compression — "Can we finish two weeks earlier?" — the critical path tells you exactly where to look. Shortening a non-critical task does nothing to the end date. Shortening a critical task by two weeks shortens the project by two weeks — assuming no other chain becomes critical first, in which case the critical path shifts and you repeat the analysis. Maverick makes this analysis fast: shorten a task in the Gantt, watch the critical path redraw, see the new end date.
Assigning Resources to the Gantt
A task bar in the Gantt chart doesn't have to be anonymous. Once resources are assigned to a task, Maverick can label the bar with the names of the people or equipment doing the work. A resource-labeled Gantt tells you not just when each task happens, but who is responsible for it — transforming the chart from a schedule into a staffing plan.
Maverick supports three resource types — human team members, machines, and materials — and allows multiple resources of multiple types to be assigned to any single task. Once a resource is assigned, Maverick marks them as allocated for the duration of the task. The Resource Allocation view then reflects that commitment, flagging any windows where the same resource is over-allocated across simultaneous tasks.
Filtering the Gantt by resource is one of the most practical views for day-to-day management. Select a single team member and the Gantt shows only their tasks, in sequence, with durations and dates — effectively their personal project schedule. Filter to a specific workgroup and the chart shows only that team's commitments. This filtered view is clear enough to send to a team member who has never used Maverick, or to print for a planning meeting.
For a complete walkthrough of assigning resources to tasks — including workgroup browsers, percentage vs. hour allocations, and the color-coded allocation bar chart — see:
Assigning Resources to Project Tasks
Tracking Progress Against the Baseline

A Gantt chart is most powerful when it reflects not just what was planned, but how the project is actually going. Maverick tracks schedule health in two ways: percentage complete and baseline comparison.
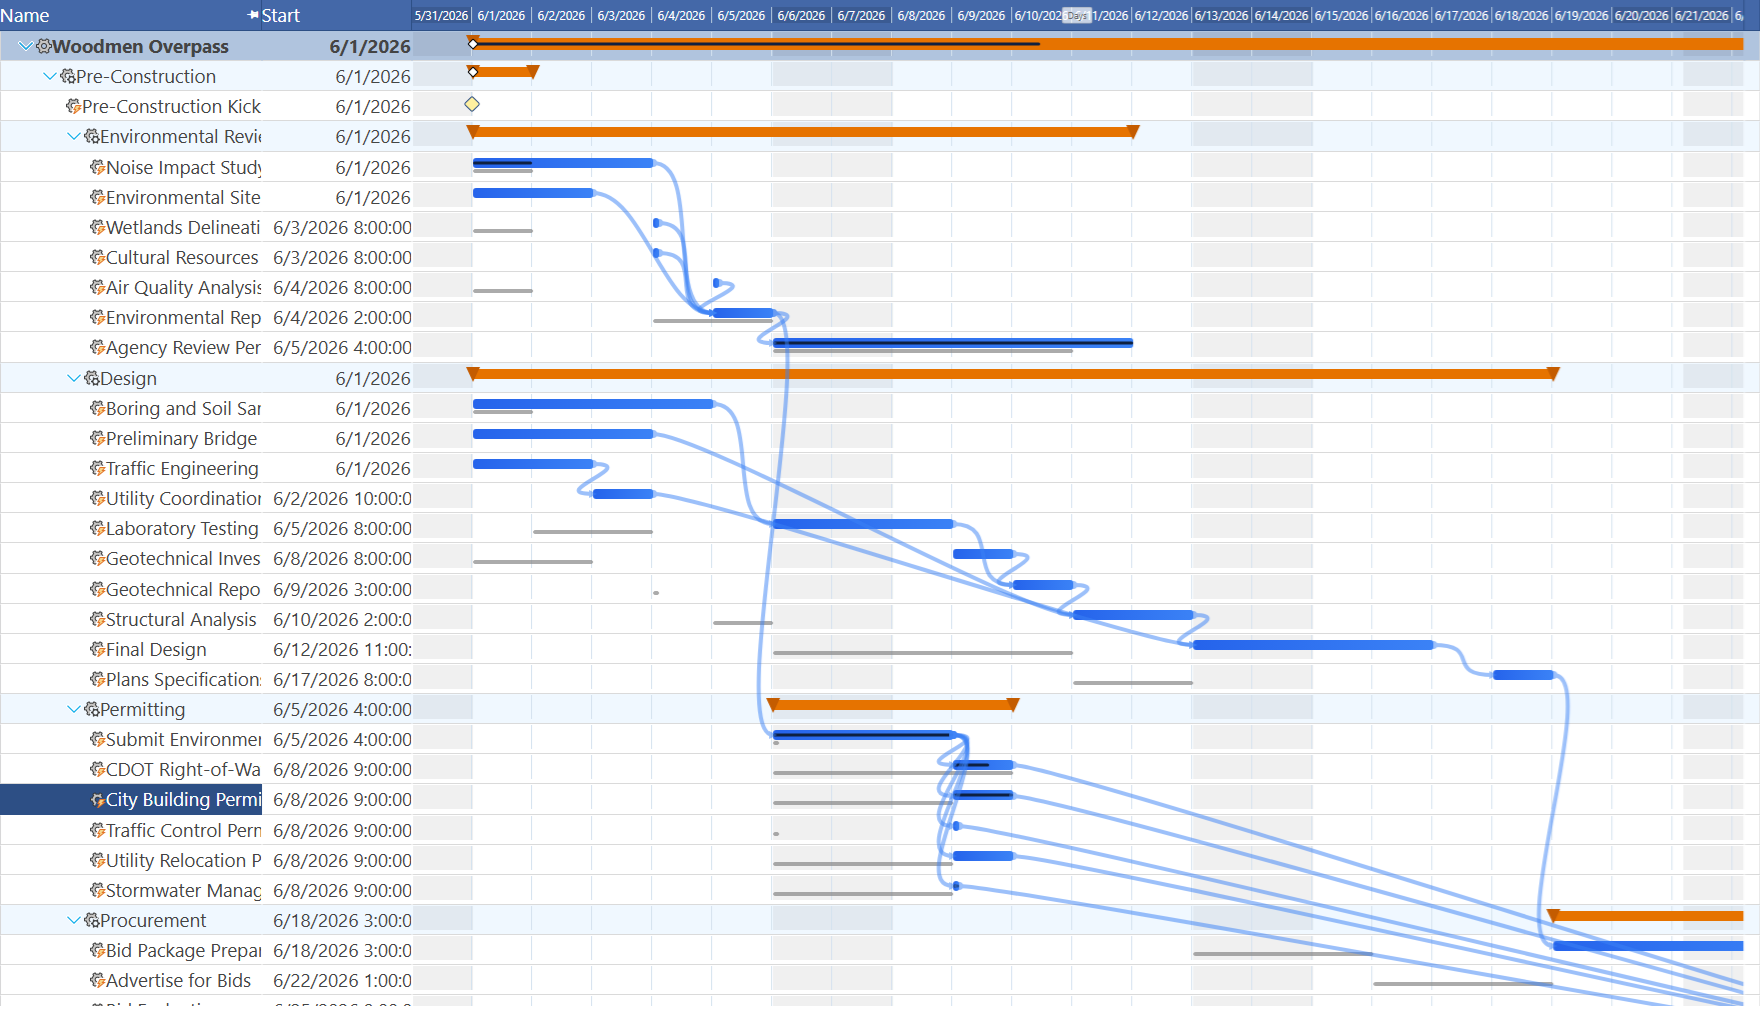
Percentage complete is the most direct measure of task progress. As a task's percent complete climbs from 0% to 100%, Maverick overlays a progress indicator on the task bar in the Gantt — a visual fill that advances from left to right across the bar. At a glance, you can see which tasks are half-done, which are nearly finished, and which haven't started yet. If a task's bar is supposed to end today but its progress fill only reaches the halfway point, the task is behind.
To make that comparison precise, Maverick supports baselines. A baseline is a snapshot of the project's planned schedule saved at a specific moment — typically when the project is approved and work begins. Maverick stores the original start date, finish date, and duration for every task at the time the baseline is captured.
As the project evolves and dates shift — tasks run long, dependencies get added, resources change — the Gantt can show both the baseline and the current schedule simultaneously. Each task row displays two bars: a ghost bar at the baseline position and the current bar at its revised position. Tasks that are running late appear with their current bar offset to the right of their ghost. Tasks that are ahead of schedule appear with their current bar to the left.
This baseline-vs-actual view is one of the most honest ways to communicate schedule performance. A project where most task bars align with their ghosts is running as planned. A project where task after task has drifted right is behind — and the Gantt makes it visually undeniable in a way that a table of dates never quite does. No interpretation required: you see the slip.
A today line — a vertical marker on the Gantt at the current date — gives every task bar an immediate status check. A task whose bar ends to the left of the today line and whose progress fill is complete is done. A task whose bar straddles the today line and whose progress fill matches the position of the today line is perfectly on schedule. A task whose bar ends to the right of the today line but whose progress fill stops short of the today line is behind.
Weekend shading highlights Saturday and Sunday columns in a subtler background tone, making work days and non-work days immediately distinguishable without counting columns. At higher zoom levels this is especially useful for confirming that a task doesn't start on a Friday afternoon and run straight through a weekend.
Set, Clear, and Restore Baselines in Maverick
Secondary Gantt Charts
The project tasks Gantt is Maverick's primary working view, but it isn't the only Gantt in the application. Two secondary Gantt views draw from the same project data and present it from different angles — one focused on resources, one focused on the full project portfolio.
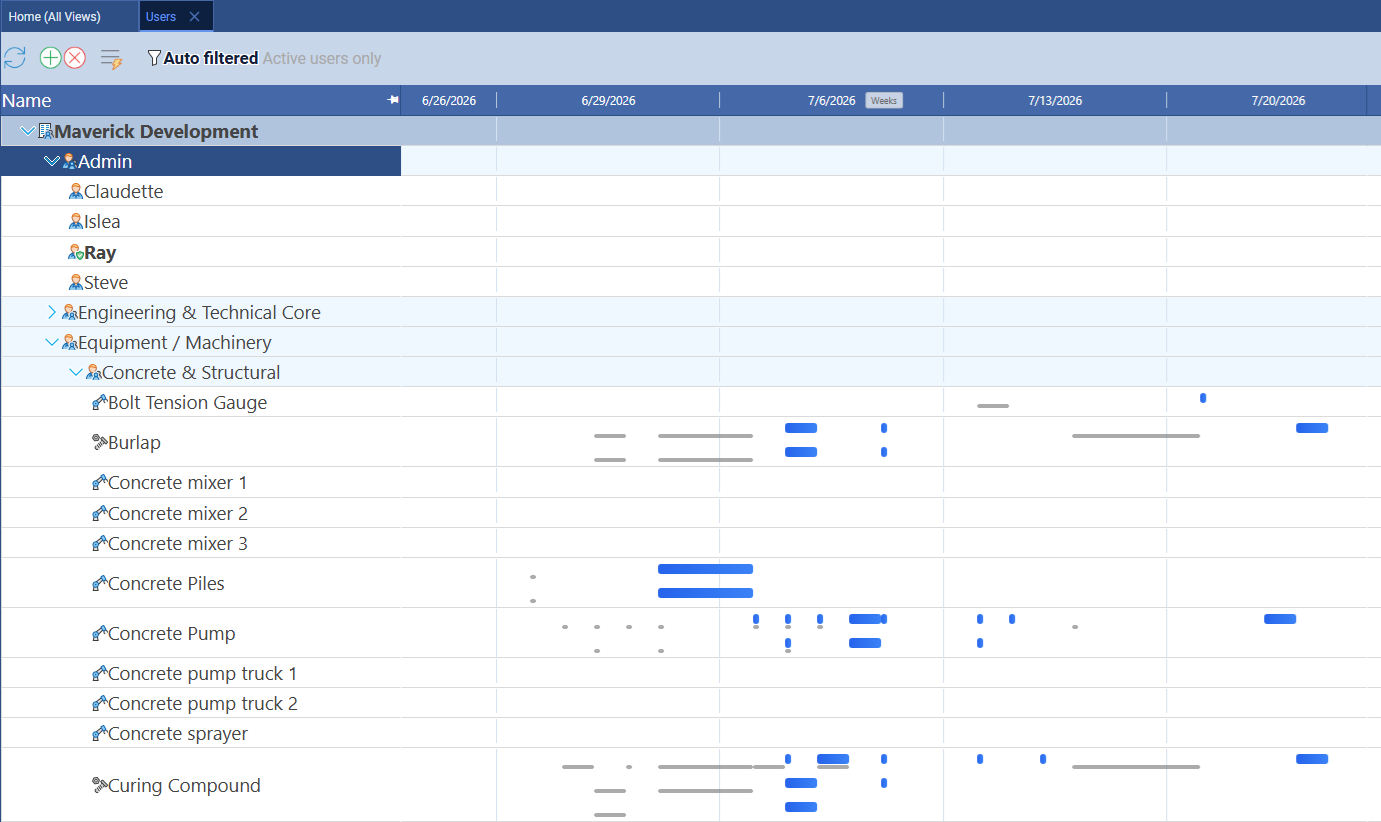
The resource-centric Gantt (Users page) shows resources as rows instead of tasks. Every task assigned to a person, machine, or material appears as a bar on that resource's row — across all active projects simultaneously. This is the fastest way to spot double-booking: two tasks from different projects claiming the same resource in the same time window are invisible in the task Gantt but immediately obvious here as overlapping bars.
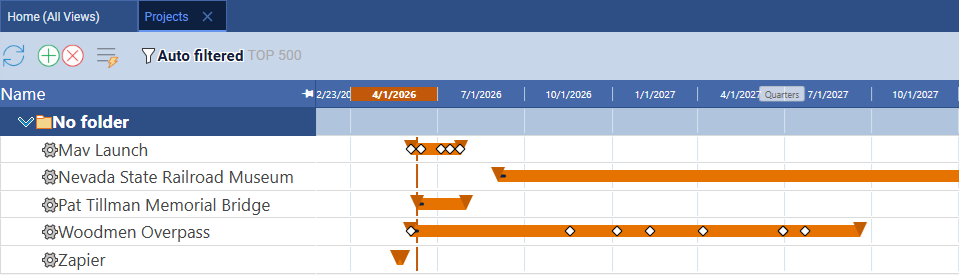
The project overview Gantt (Projects page) shows entire projects as rows, each bar spanning a project's full start-to-finish timeline. Milestone diamonds are overlaid at their scheduled dates. Use this view to see how all active projects relate to each other on the calendar, where milestones cluster across the quarter, and which periods carry the heaviest load — without opening individual project files.
Secondary Gantt Charts — Full Guide
Editing the Schedule Directly in the Gantt
Maverick's Gantt chart is fully interactive — you can edit task dates by manipulating bars directly on the timeline without opening any property panel.
Drag to reschedule: Click and drag any task bar left or right to change its start date. The finish date shifts by the same number of days, preserving the task's original duration. All downstream tasks connected by dependencies update immediately, cascading the change through the entire schedule in real time. The bar shows the new start date while you drag so you can land exactly where you want.
Drag to resize: Grab the right edge of any task bar and drag to extend or shorten the finish date while keeping the start date fixed. A floating date label tracks your cursor and displays the new finish date as you drag — precise enough to set a finish date without any arithmetic.
Right-click context menu: Right-clicking any task bar opens a context menu with direct scheduling actions — a fast path to the most common operations without navigating the ribbon or opening property panels.
Navigating the Gantt View in Maverick
Maverick's Gantt view is designed to be useful whether you're managing a two-week sprint or a two-year product roadmap. A handful of navigation controls let you adjust the view to match the level of detail you need in the moment.
Zoom controls adjust the time scale. Scroll the mouse wheel over the Gantt header to zoom in or out continuously; drag the resize handle at the edge of any scale interval to adjust the pixels-per-day level precisely. You can also use the zoom buttons in the header. Zoom out to see the entire project at once — every task bar, every phase, every milestone visible without scrolling. Zoom in to see individual days and confirm that a task starting Monday doesn't accidentally land on a holiday, or that two tasks assigned to the same person don't overlap at the day level. The timescale supports hours, days, weeks, months, quarters, and years.
Column selection lets you show or hide columns in the task list alongside the Gantt bars. Display only task names for the cleanest visual. Expand the view to include start date, finish date, duration, assigned resources, percent complete, cost, and float alongside each bar. This makes the Gantt view work double duty as a task grid — one pane for the data, one pane for the visual.
Filtering narrows the view to specific subsets of the project. Filter to a single phase to focus a team standup. Filter to in-progress tasks to see only the active work. Filter to critical tasks to review the path to the end date without distraction from non-critical work. Filter to a specific resource to build that person's personal schedule. Maverick's filters persist while you work and can be combined — critical tasks assigned to a specific workgroup, for example.
Panning moves the visible window through the project timeline. Drag anywhere on the Gantt background (not on a specific bar) to scroll forward or backward through time. Navigation buttons at the top of the Gantt column let you step or scroll left and right without grabbing the background. All bars, link lines, float indicators, and the today line reposition instantly as you pan.
Collapsing and expanding summary rows lets you control the level of detail on screen. In a large project with hundreds of tasks, showing every task simultaneously makes the chart too dense to read. Collapse all phases and show only the phase bars for a 30,000-foot view; expand only the phase currently being executed for a focused working view. Maverick remembers which rows you've expanded and collapses them back to the same state when you return to the project.
Printing and exporting take the Gantt chart out of Maverick and into a presentation, PDF report, or stakeholder email. The chart renders cleanly for print, maintaining color-coding, bar labels, and dependency arrows, scaled to fit the page you specify.
See the Gantt Chart in Action
Start a free cloud trial and build your first project — add tasks, set dependencies, assign resources, and watch the critical path calculate in real time. The full Gantt view, resource allocation charts, and AI chat are all available from day one, no credit card required.
Access the Free Cloud Trial
