Project Overview
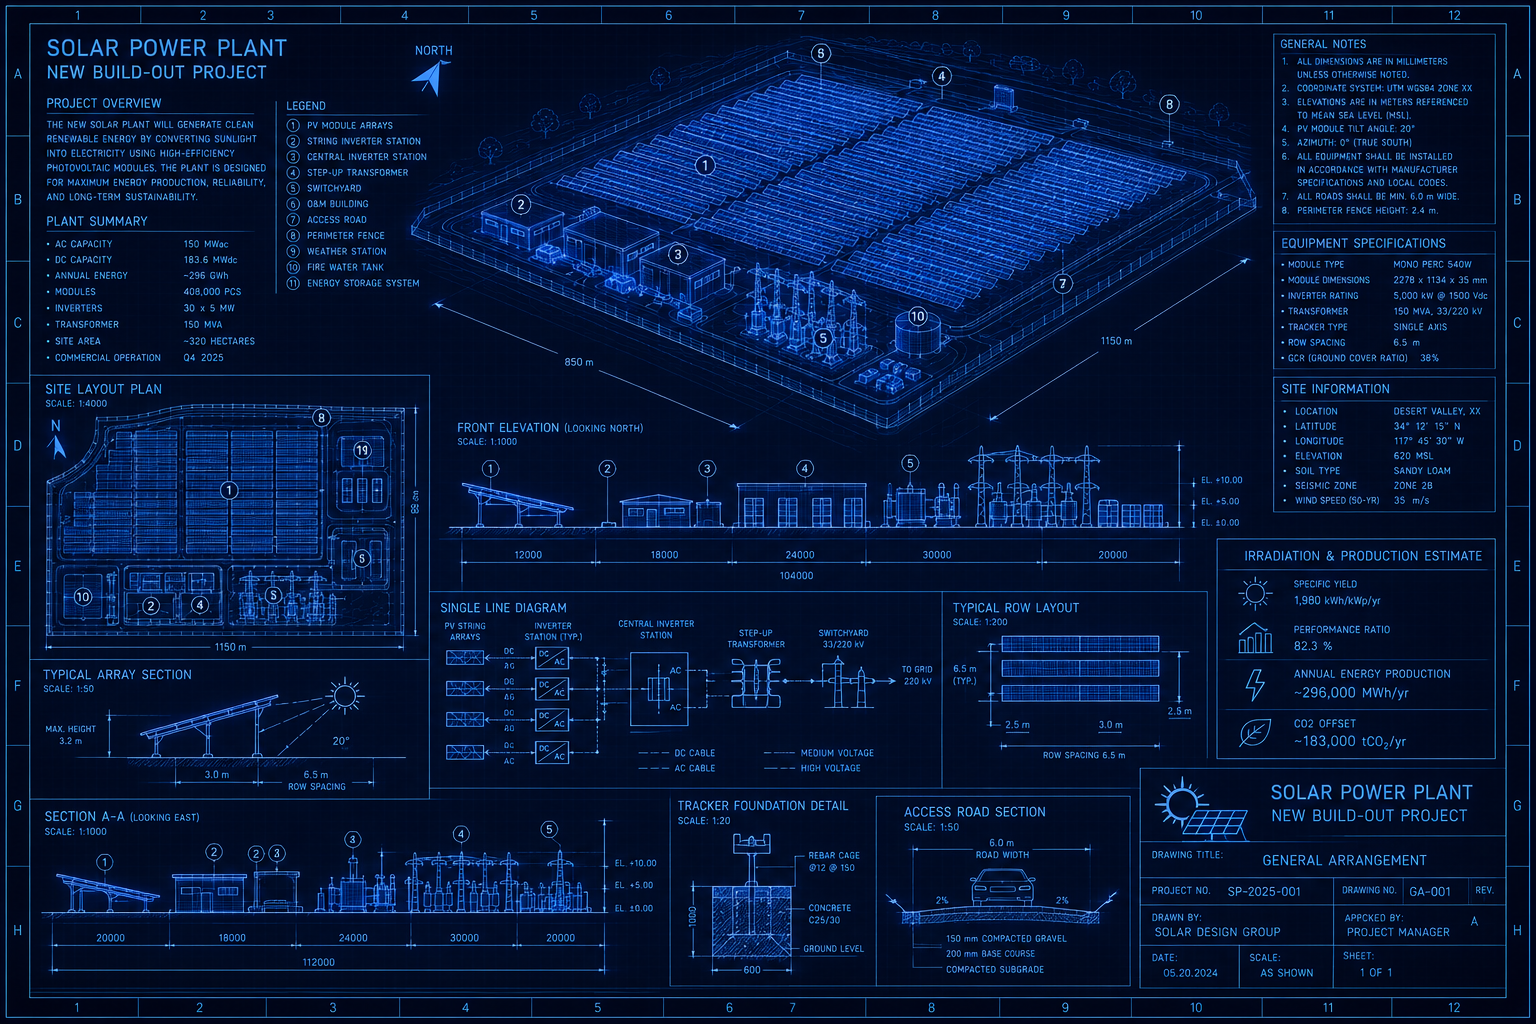
You have been brought in as the project manager for Kingman, AZ's 5MW ground-mount solar installation — a 50-acre renewable energy site in the American Southwest with a fixed grid interconnect deadline enforced by the regional utility. The project involves seven subcontractor crews working in overlapping sequences, $530,000 in materials that must be ordered weeks before the site is ready to receive them, and a utility commissioning window that cannot move. One week of slippage on the critical path translates directly to a delayed revenue start for the city.
This blueprint walks you through building the complete project schedule in Maverick from scratch. You will enter 31 tasks across 7 phases, wire Finish-to-Start and Start-to-Start dependencies, assign all three resource types, lock the baseline against the interconnect deadline, run the critical path, simulate a mid-project progress check, use AI to detect crew conflicts, and track costs against quoted budgets. By the end you will have a fully functional schedule that demonstrates every major scheduling feature in Maverick on a project with real stakes.
What You'll Practice
- Task hierarchy: 7 summary phases with 31 subtasks
- Finish-to-Start dependencies for sequential phase handoffs
- Start-to-Start dependencies with lag for staggered section crews
- All three resource types: human crews, heavy equipment (machine), and solar panels (material)
- Critical path calculation across a 20-week build schedule
- Baseline creation and variance tracking against a fixed utility deadline
- Project costing with quoted budgets and material cost tracking
- AI scheduling to detect crew conflicts and suggest optimizations
Phase 1: Project Setup
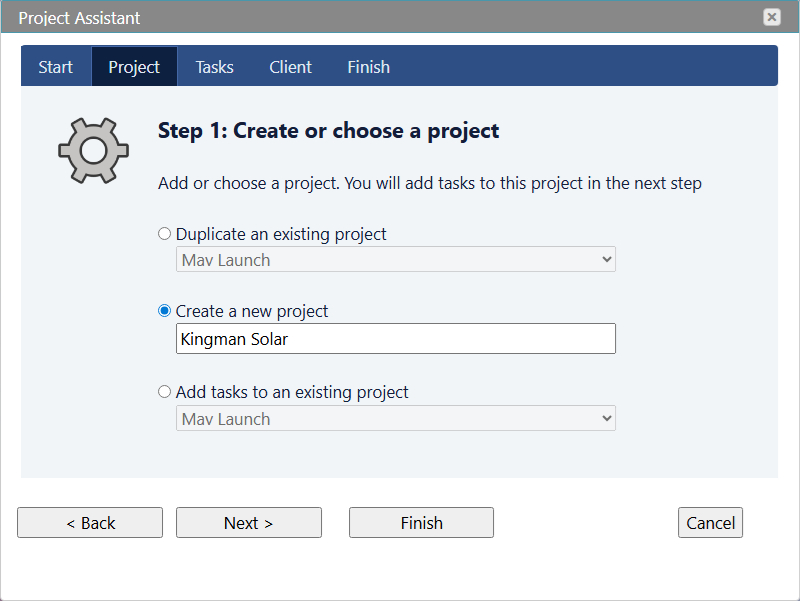
Start on the Maverick Home page and open the Project Assistant to create the project. The assistant guides you through naming the project and entering the initial task structure before you see the Gantt chart for the first time.
- Home → Project Assistant → Create a project
- Project name: Kingman Solar Plant — 5MW Build
- Click Next to open the task list editor
- Enter the 7 phase names at the first indent level (these become summary tasks): Site Preparation, Permits & Procurement, Foundation & Racking, Panel Installation, Electrical Systems, Grid Interconnect, Commissioning
- Click Save and Close to create the project and open it in the Gantt chart
With the 7 phases created, you can add the subtasks using the simplified text editor. Click on any project row, find the Tasks property in the right-hand Properties panel, and click it to open the text editor. Indent subtask names under each phase name — Maverick converts the indentation into the task hierarchy.
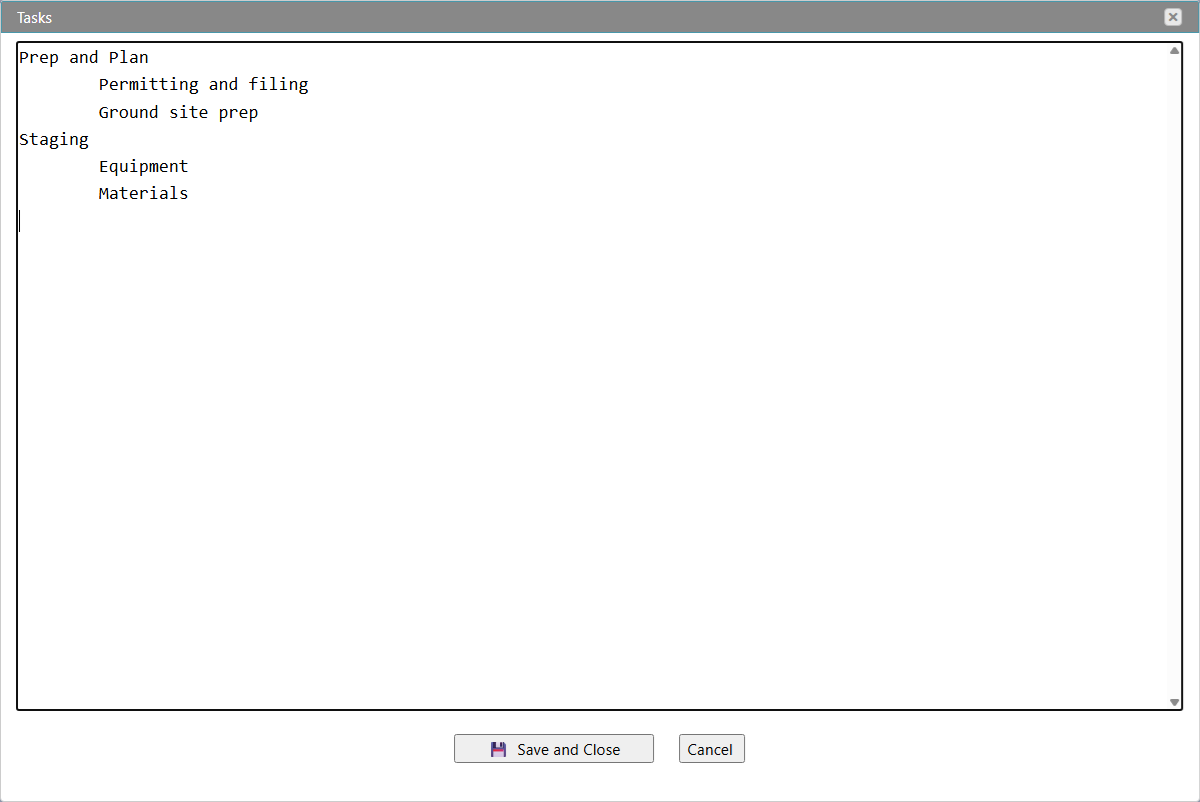
Phase 2: Build the Task List
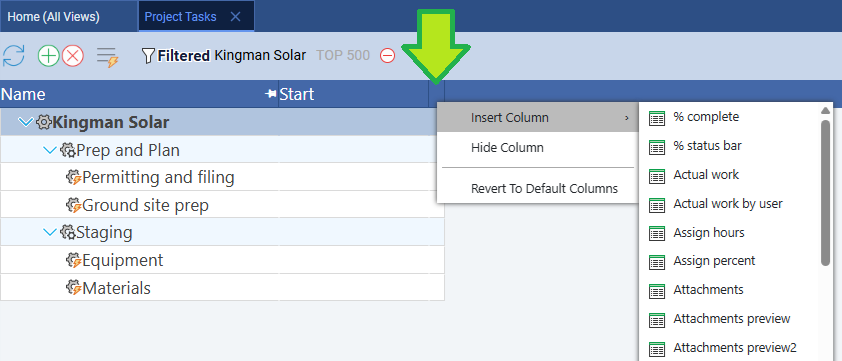
Enter all 31 tasks across the 7 phases. Use the reference table below for task names and durations. Right-click any column header to insert additional columns — add Duration, Start, and Finish so you can see the schedule take shape as you work.
| Phase | Task | Duration |
|---|---|---|
| 1 — Site Preparation | Environmental survey | 5 days |
| 1 — Site Preparation | Geotechnical survey | 3 days |
| 1 — Site Preparation | Land clearing & grading | 10 days |
| 1 — Site Preparation | Access road construction | 5 days |
| 1 — Site Preparation | Perimeter fencing | 5 days |
| 2 — Permits & Procurement | Building permit application | 2 days |
| 2 — Permits & Procurement | Utility interconnect application | 3 days |
| 2 — Permits & Procurement | Solar panel order (10-week lead) | 2 days |
| 2 — Permits & Procurement | Inverter order (8-week lead) | 2 days |
| 2 — Permits & Procurement | Racking hardware order (6-week lead) | 2 days |
| 2 — Permits & Procurement | Electrical BOS order (4-week lead) | 2 days |
| 3 — Foundation & Racking | Structural pile driving | 15 days |
| 3 — Foundation & Racking | Racking assembly — Section A | 8 days |
| 3 — Foundation & Racking | Racking assembly — Section B | 8 days |
| 3 — Foundation & Racking | Racking assembly — Section C | 8 days |
| 4 — Panel Installation | Panel delivery & staging | 1 day |
| 4 — Panel Installation | Panel mounting — Section A | 8 days |
| 4 — Panel Installation | Panel mounting — Section B | 8 days |
| 4 — Panel Installation | Panel mounting — Section C | 8 days |
| 4 — Panel Installation | String wiring | 10 days |
| 5 — Electrical Systems | Inverter pad construction | 4 days |
| 5 — Electrical Systems | Inverter installation | 4 days |
| 5 — Electrical Systems | DC combiner boxes | 3 days |
| 5 — Electrical Systems | AC collection system | 6 days |
| 5 — Electrical Systems | Substation transformer | 5 days |
| 6 — Grid Interconnect | Utility coordination meeting | 1 day |
| 6 — Grid Interconnect | Metering installation | 3 days |
| 6 — Grid Interconnect | Protection relay settings | 2 days |
| 6 — Grid Interconnect | Interconnect testing | 5 days |
| 7 — Commissioning | Pre-commissioning inspection | 3 days |
| 7 — Commissioning | System energization | 2 days |
| 7 — Commissioning | Performance testing & handover | 5 days |
Phase 3: Link Dependencies
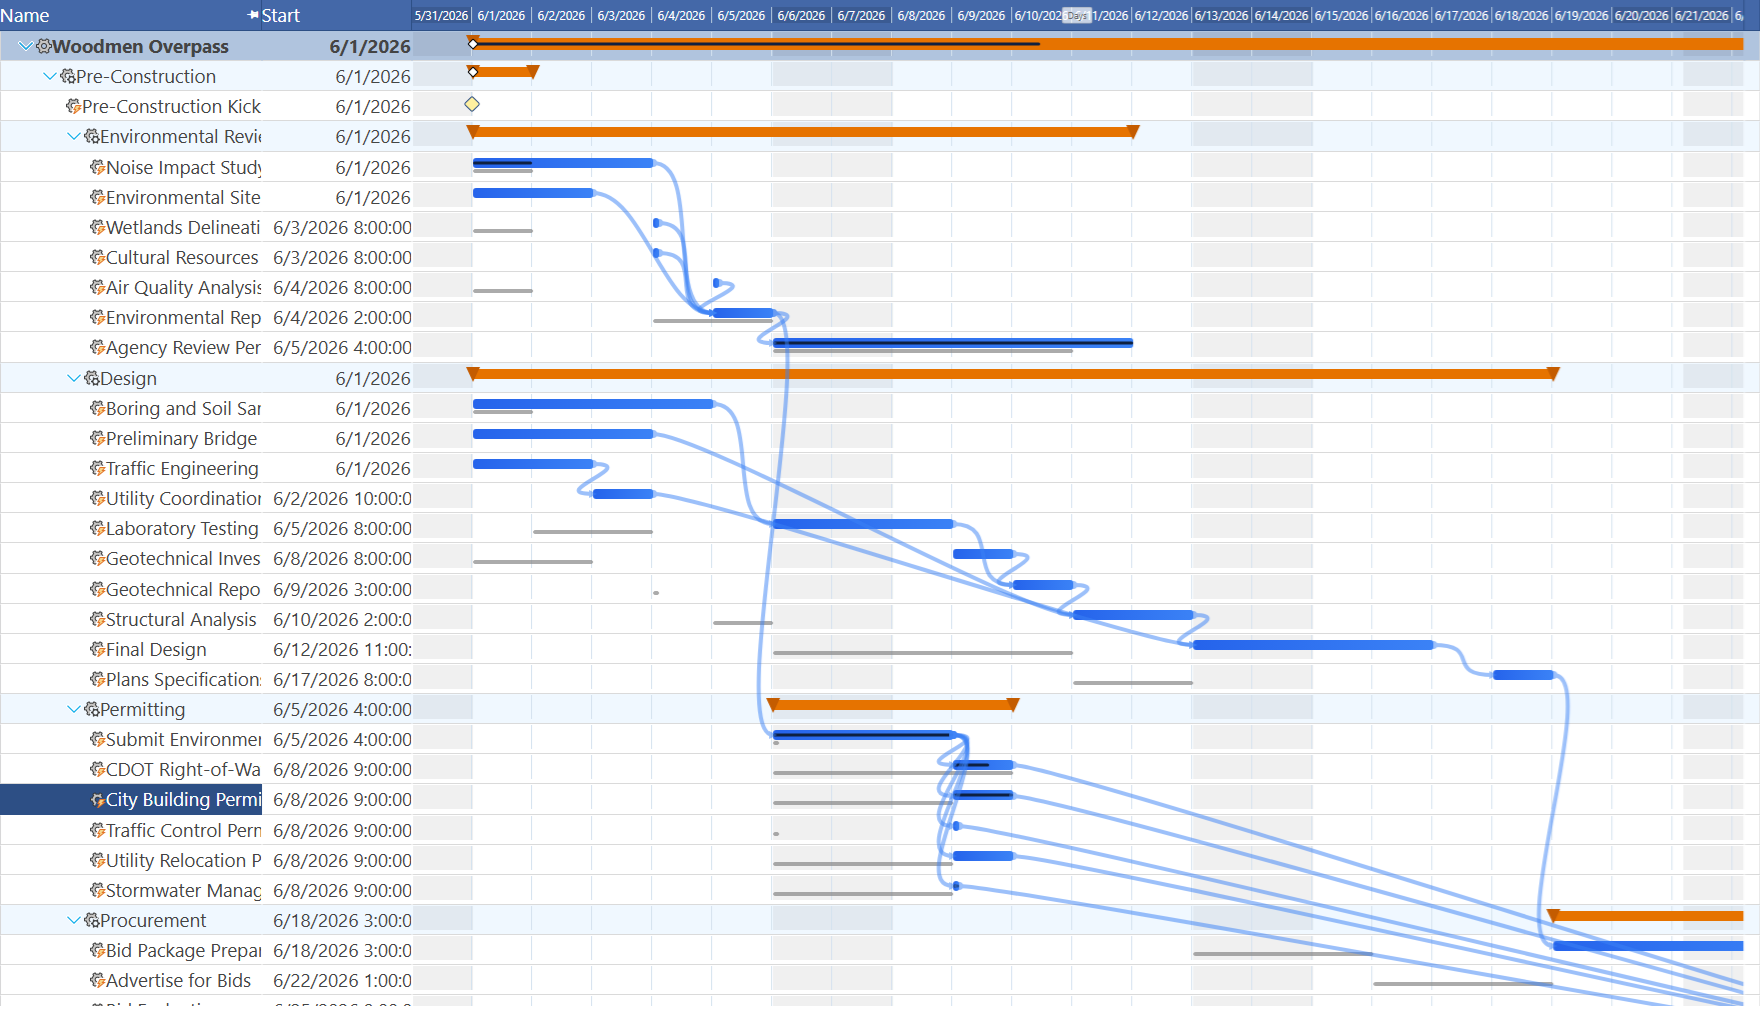
Most of the dependencies in this project are Finish-to-Start: one phase cannot begin until the previous one completes. The foundation cannot start until land clearing finishes. Panels cannot be mounted until the racking section is ready. Interconnect testing cannot happen until all electrical work is complete. Wire these with FS links by right-clicking a task, choosing Links…, clicking the + button under Outbound tasks, and selecting the successor.
The interesting dependency pattern in this project is the staggered crew work in Phases 3 and 4. You have one racking crew that works Section A, then shifts to Section B, then Section C. Rather than waiting for Section A to be fully racked before starting B, the crew can overlap with a 2-day lag: Racking B starts 2 days after Racking A starts. This is a Start-to-Start link with a 2-day lag. Apply the same SS+2d pattern to Racking C after B, and to Panel Mounting B and C in Phase 4. SS links with lag are one of the most powerful scheduling tools for construction projects — they compress the schedule without creating resource conflicts.
Two procurement tasks also have important dependencies. The solar panels have a 10-week lead time — that is the duration between placing the order and delivery arriving on site. The panel order task itself takes 2 days (filling out the purchase order), but the 10-week lead is what makes panel procurement a scheduling risk: if the order is placed late, delivery pushes out, and Panel Installation cannot start. Link Panel delivery & staging as a successor to the panel order task so that the Gantt reflects the true dependency chain. Do the same for the inverter and hardware orders.
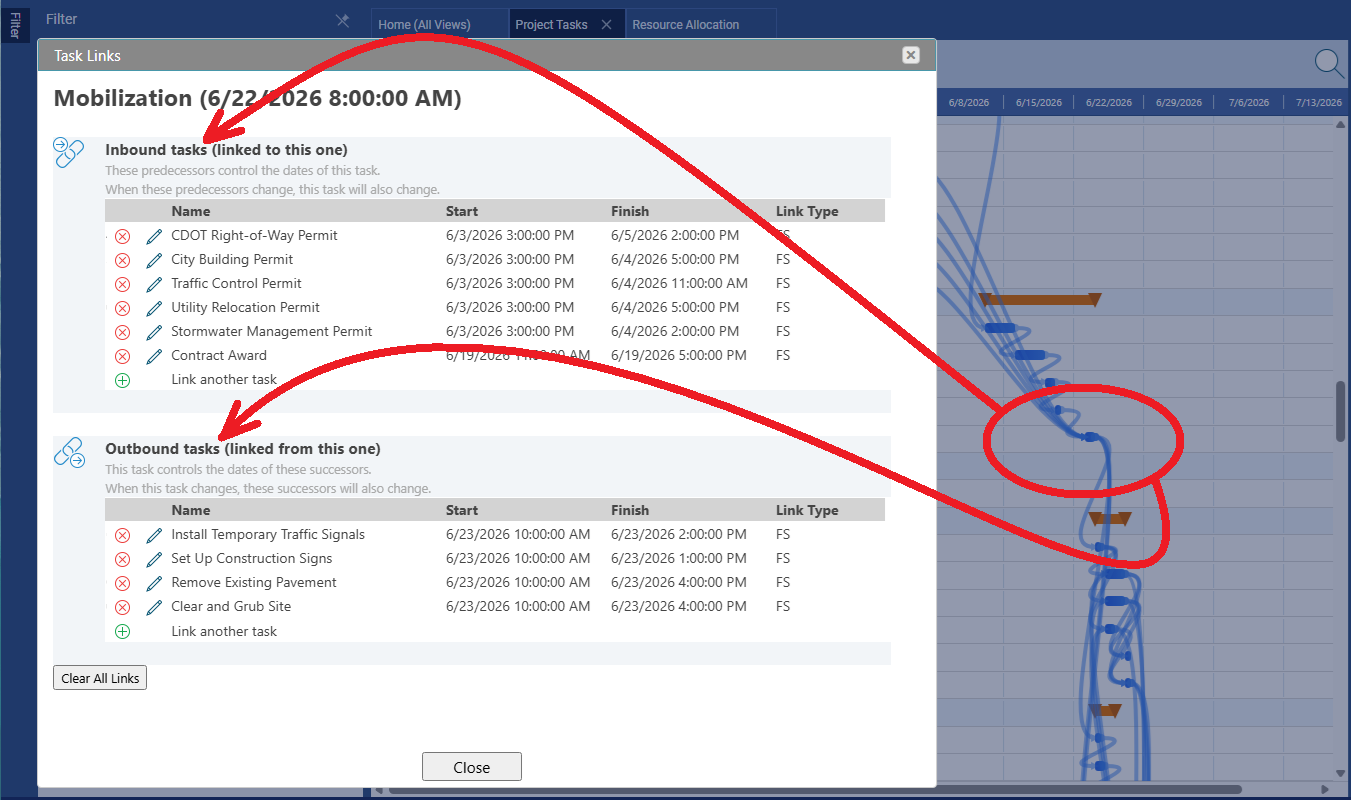
What is an outbound task? An outbound task is a successor — a task that depends on the current task before it can start (or finish, depending on the link type). When you add an outbound task to the Links dialog, you are saying "this task drives that one." In the Kingman schedule, Racking Section A has Racking Section B as an outbound task: A must start before B can begin.
What is an inbound task? An inbound task is a predecessor — a task that the current task depends on. Adding an inbound task means "this task cannot start until that one is done (or started)." Pile Driving is an inbound task to Racking Section A: racking cannot begin until the foundations are in the ground.
Phase 4: Assign Resources
This project uses all three Maverick resource types. Create them first under Home → Users, then assign them to tasks.
- Human resources: Site Superintendent, Civil Crew, Electrical Crew, Panel Installation Crew, Commissioning Engineer
- Machine resources: Pile Driver, Crane
- Material resources: Solar Panels (1,200 units), Racking Hardware, Electrical BOS
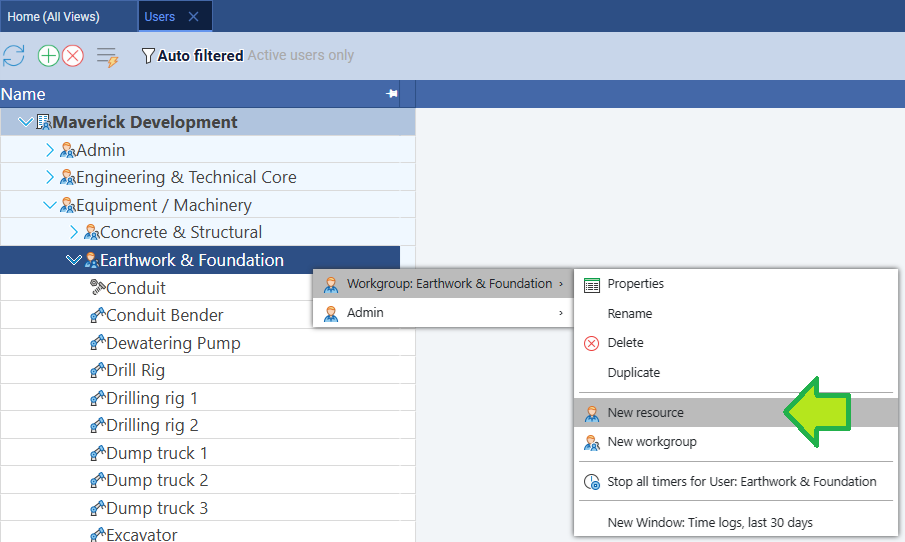
To create each resource: click on a workgroup, click the green + button, enter the resource name, and choose the resource type. Machine and material resource types are set in the same dialog as human resources.
After creating the resources, assign them to tasks. Click any task, find the Users property in the Properties panel, and choose from the dropdown. For the Panel Installation Crew, assign them at 100% to each panel mounting task. For the Pile Driver and Crane, assign them at 100% to the pile driving and racking tasks respectively. For Solar Panels (material), enter the quantity — 400 panels per section, 1,200 total — in the allocation field.
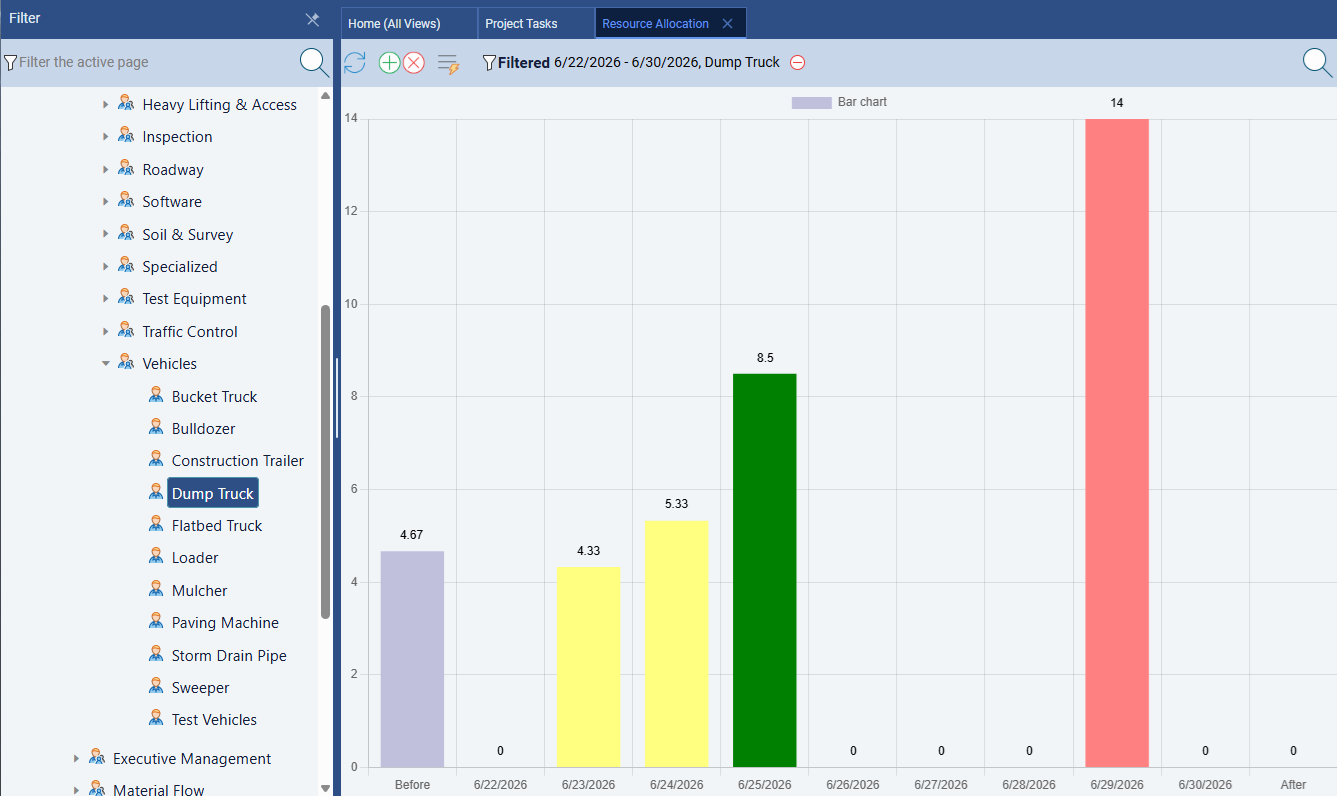
The resource-centric Gantt view shows all three resource types in a single view — each row is a resource, and the bars show every task assigned to that resource across all projects. This is the fastest way to spot scheduling conflicts between crews.
Phase 5: Set the Baseline
The utility has given Kingman a specific interconnect testing window. If the project misses it, the next available window is six weeks later. This is exactly the kind of hard deadline that makes baseline tracking essential: every task slip must be immediately visible so you can decide whether to accelerate, resequence, or escalate.
Once the plan has been reviewed and approved by the township project board, set the baseline. Right-click any project row and choose Advanced → Set baseline for all tasks. Maverick locks the current start and finish dates of every task as the baseline reference. From this point forward, the Gantt chart shows ghost bars for each task so you can see drift at a glance.
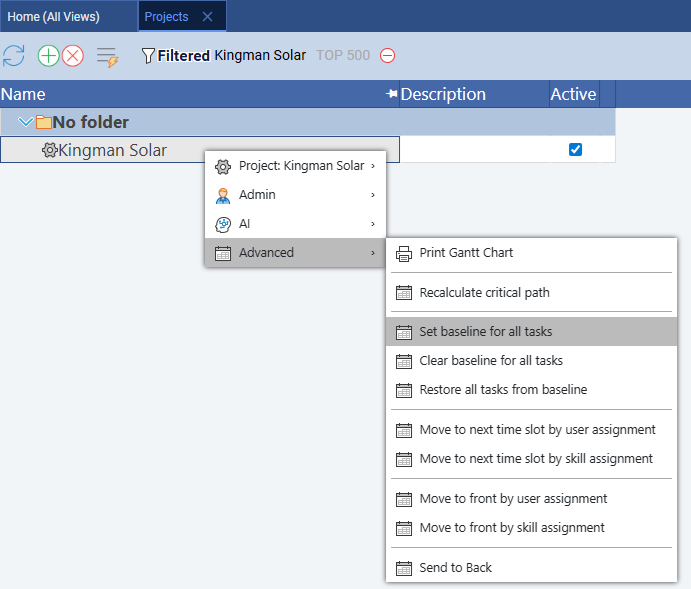
How to read the baseline in the Gantt chart. After you set the baseline, look for small gray ghost bars sitting just below each normal task bar. Those ghost bars mark where each task was planned to start and finish at the moment you locked the baseline. As work progresses and dates shift, compare the ghost bar to the live bar: if they line up, the task is on schedule. If the live bar has drifted to the right of its ghost, the task has slipped by exactly that distance. If it sits to the left, the task finished or started earlier than planned. The further the two bars diverge, the more the schedule has drifted from the approved plan.
Phase 6: Run the Critical Path
Right-click any project row and choose Advanced → Recalculate critical path. Maverick highlights critical tasks in red. For this project, the critical path runs through: Land clearing → Structural pile driving → Racking Section A → Panel Mounting Section A → String wiring → AC collection system → Substation transformer → Interconnect testing → Performance testing & handover.
Tasks that fall outside the critical path have float — time they can slip without pushing the project end date. The environmental and geotechnical surveys in Phase 1 have float because they finish before land clearing is needed. The procurement tasks in Phase 2 have float as long as deliveries arrive before the installation phases need them — but the solar panel order, with its 10-week lead, is the closest procurement task to being critical. If the order is placed even a few days late, panel delivery slips into the panel mounting window and the path becomes critical.
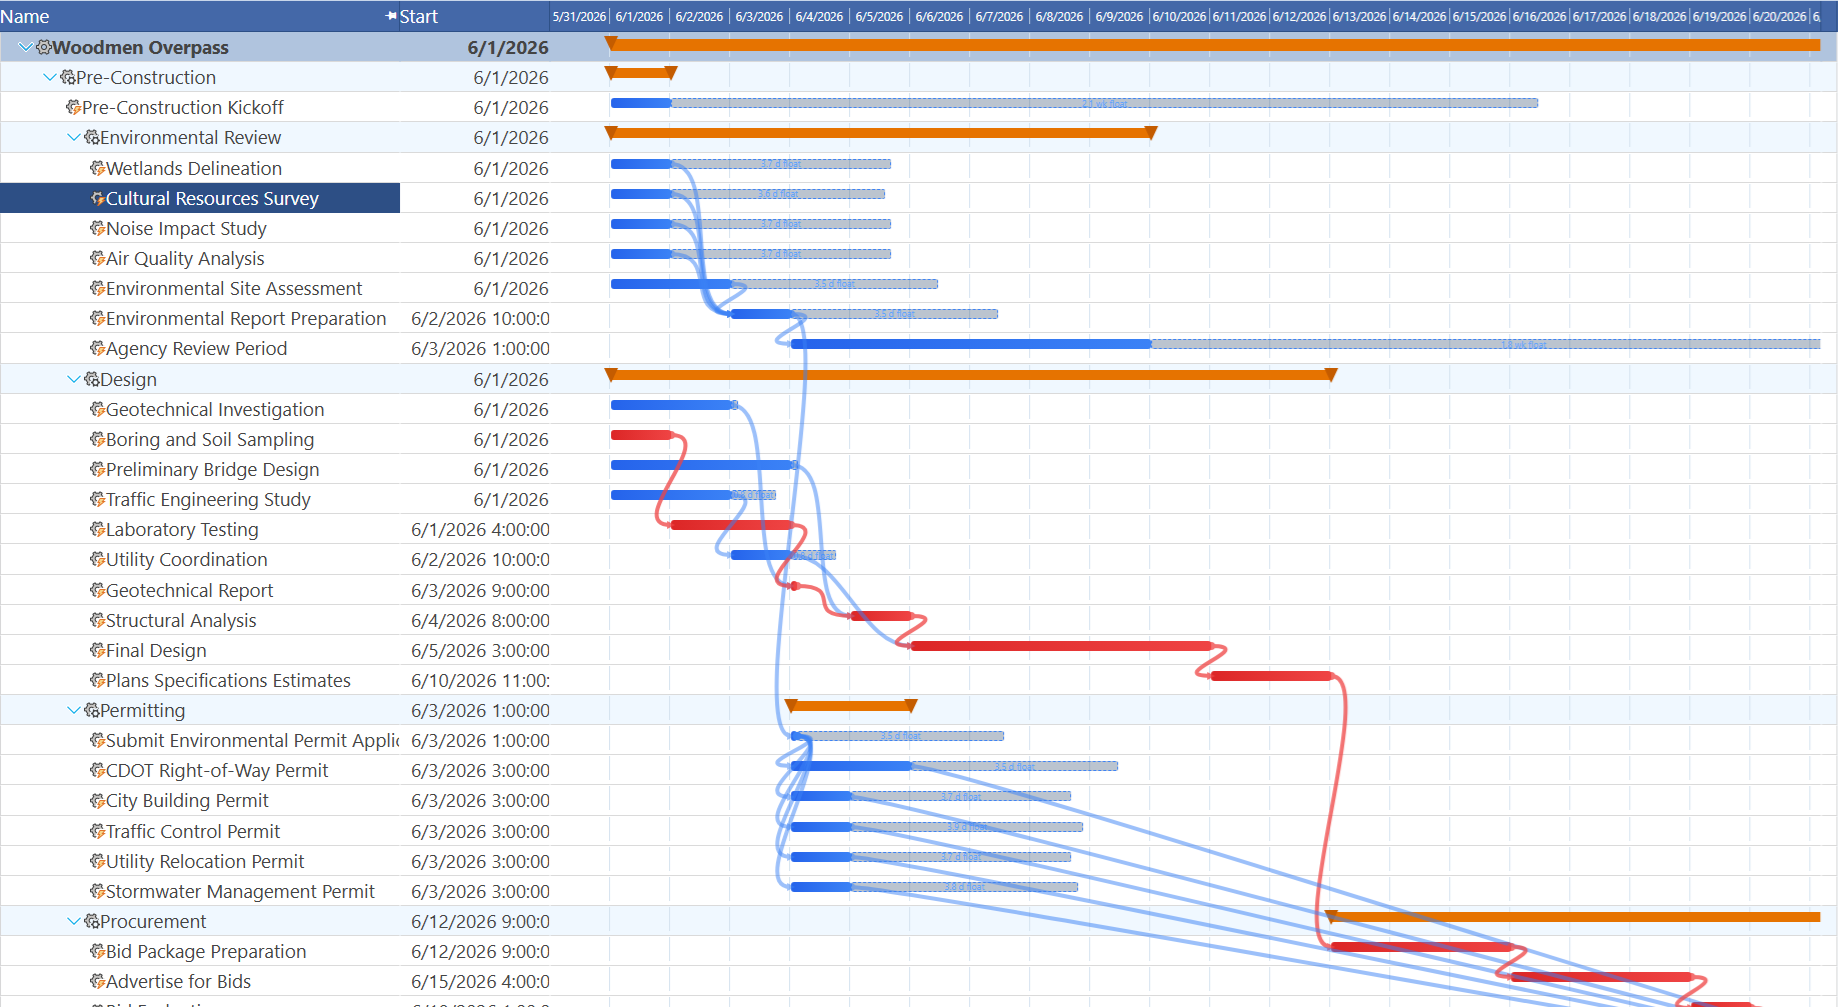
How to read the critical path in the Gantt chart. After recalculating, look for task bars highlighted in red. Red bars are critical — they have zero float, meaning any delay to that task pushes the project end date by the same amount. Blue (or default-colored) bars have float and can slip slightly without affecting the finish date. The red bars form a connected chain from the first task to the last: that chain is your critical path. On the Kingman schedule, keep a close eye on the red bars during construction — a one-day slip on pile driving ripples all the way to the utility interconnect window.
Phase 7: Simulate Progress
Advance the project to Week 8 — roughly the midpoint of Phase 3. Mark the Phase 1 tasks as 100% complete. Mark pile driving at 80% complete (12 of 15 days elapsed). Racking Section A is 50% complete; Sections B and C have not started yet. Enter these values by clicking each task and editing the Percent Complete property in the Properties panel.
Compare the current task bars against the baseline ghost bars. If pile driving is running a day behind, the ghost bar sits slightly to the left of the current end of the active bar. That one-day slip propagates forward to Racking A, then Racking B and C (via SS links), then Panel Mounting, then String Wiring — all the way to Interconnect Testing. The Gantt makes this cascade visible without any manual calculation.
Check the resource allocation bar chart to confirm the Civil Crew is not over-allocated during the period when access road construction, fencing, and pile driving overlap.
Try the timesheet to simulate progress. Instead of setting percent complete directly on a task, try entering hours into the Maverick timesheet — this is closer to how real projects work. Go to Home → Timesheet, find the task row, and enter daily hours for each crew member. As hours accumulate, Maverick updates the task's actual work and recalculates percent complete automatically. The Gantt chart reflects this immediately: a filled portion inside the task bar grows from left to right as work is logged, giving you a visual read on how much of each task is truly done versus how much remains.
Phase 8: AI Scheduling
Right-click the project row and choose AI → Chat with AI. A chat window opens for this project. Click OK to let the AI analyze the current schedule, then enter a prompt:
Identify any crew conflicts in the racking and panel installation phases. The Panel Installation Crew is assigned to all three panel mounting sections. Given the SS+2d lag between sections, are there any days where the crew is double-booked? If so, suggest how to adjust the lag or crew split to resolve it.
The AI reviews the task assignments and dependency structure and responds with a specific recommendation — for example, increasing the SS lag to 3 days to give the single crew time to finish Section A panels before overlapping with Section B, or splitting the crew into two parallel teams. Click OK to allow the AI to apply its suggested changes to the schedule, then review the updated Gantt chart.
Quick prompts to try on the Kingman project:
- Which tasks are on the critical path and what is the float for each non-critical task?
- Are any crews double-booked during weeks 8 through 12?
- Pile driving is running 3 days behind. Which tasks are affected and by how much?
- What is the earliest finish date if we add a second panel installation crew?
- Which procurement orders are at risk of delaying panel installation?
- Move all commissioning tasks out by one week — the utility interconnect window has shifted.
- Summarize current project status: percent complete, days remaining, and any slipped tasks.
- Generate a brief status report I can send to the township.
Phase 9: Project Costing
The Cedar Ridge solar plant is a material-heavy project: $252,000 in solar panels alone, plus racking hardware, inverters, and electrical BOS. Tracking costs in Maverick gives the city real-time visibility into budget vs. actual spend as the project progresses.
Set billing rates on each human resource by clicking the resource in the Users list and entering the Hourly Rate (internal labor cost) and Billing Rate (what the township pays the subcontractor). For material resources, enter the unit cost per panel or per unit of hardware. As timesheets are submitted and task hours are logged, Maverick automatically calculates the accumulated cost on each task.
Add cost columns to the task grid by right-clicking a column header and inserting Cost (Client), Actual Cost, Material Cost, and Quoted Cost. Enter quoted (budgeted) costs for each phase:
- Site Preparation: $45,000
- Permits & Procurement: $530,000 (materials)
- Foundation & Racking: $195,000
- Panel Installation: $85,000
- Electrical Systems: $195,000
- Grid Interconnect: $85,000
- Commissioning: $42,000
Maverick alerts you when a project's accumulated cost exceeds 90% or 100% of the quoted estimate — configure these notifications under your account preferences so the township is never surprised by an overrun.
Related Topics
The scheduling techniques used in this blueprint are explained in depth in the Maverick Learn Center. For the theory behind Gantt chart task bars, link lines, and the baseline ghost bars you saw in Phase 5, see Gantt Charts in Project Management. For how the critical path calculation works and what float means for schedule risk, see Critical Path Method. For a deeper look at baseline creation and variance tracking, see Project Baselines: Set, Clear, and Restore.
Fun Fact: Kingman Outshines Cairo
You might expect a city at 30° N latitude — Cairo, Egypt — to receive more sunlight than one at 35° N like Kingman. The math says otherwise. Kingman's higher elevation and famously clear Mohave Desert skies produce slightly higher Direct Normal Irradiance than Cairo, making it one of the best concentrated solar locations on the planet.
| Metric | Kingman, AZ (35.2° N) | Cairo, Egypt (30.0° N) |
|---|---|---|
| Climate | High desert | Desert / Arid |
| Peak sun hours / day | 6.5 – 7.0 hrs | 5.5 – 7.0 hrs |
| GHI (kWh/m²/year) | 2,200 – 2,300 | 2,100 – 2,200 |
| DNI advantage | Slightly higher — elevation + clear skies | Lower due to dust & aerosols |
| Seasonal profile | Strong summer peak; lower winter hours | Flatter year-round generation |
| Main efficiency challenge | Temperature losses at peak summer | Dust and sandstorm soiling |
Cairo's proximity to the equator does give it one advantage: winter sun hours don't dip as sharply, producing a steadier generation profile across all 12 months. Kingman compensates with exceptional summer output and some of the lowest atmospheric attenuation in North America. For a 5MW project like this one, that translates to meaningfully more annual kilowatt-hours per panel than an equivalent system installed outside Cairo. You can explore solar potential for any address worldwide using the Global Solar Atlas.