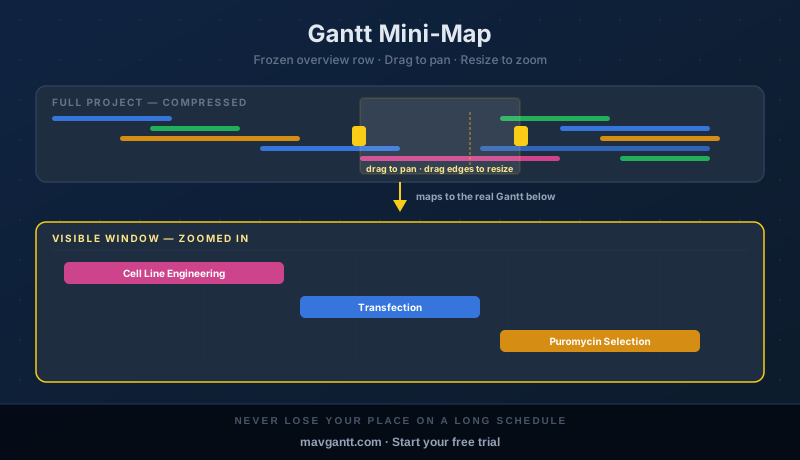
Long schedules have a navigation problem: the further a project runs, the more scrolling and zooming it takes just to answer "where am I, relative to everything else?" The Gantt mini-map is a single frozen row you can add to the top or bottom of any Gantt-capable grid — Project Tasks, Projects, Subprojects, or Users — that compresses the entire project's timeline into one thin strip. A highlighted window shows exactly which slice the real Gantt chart is currently showing, and dragging that window pans or zooms the whole view instantly.
What Is the Gantt Mini-Map?
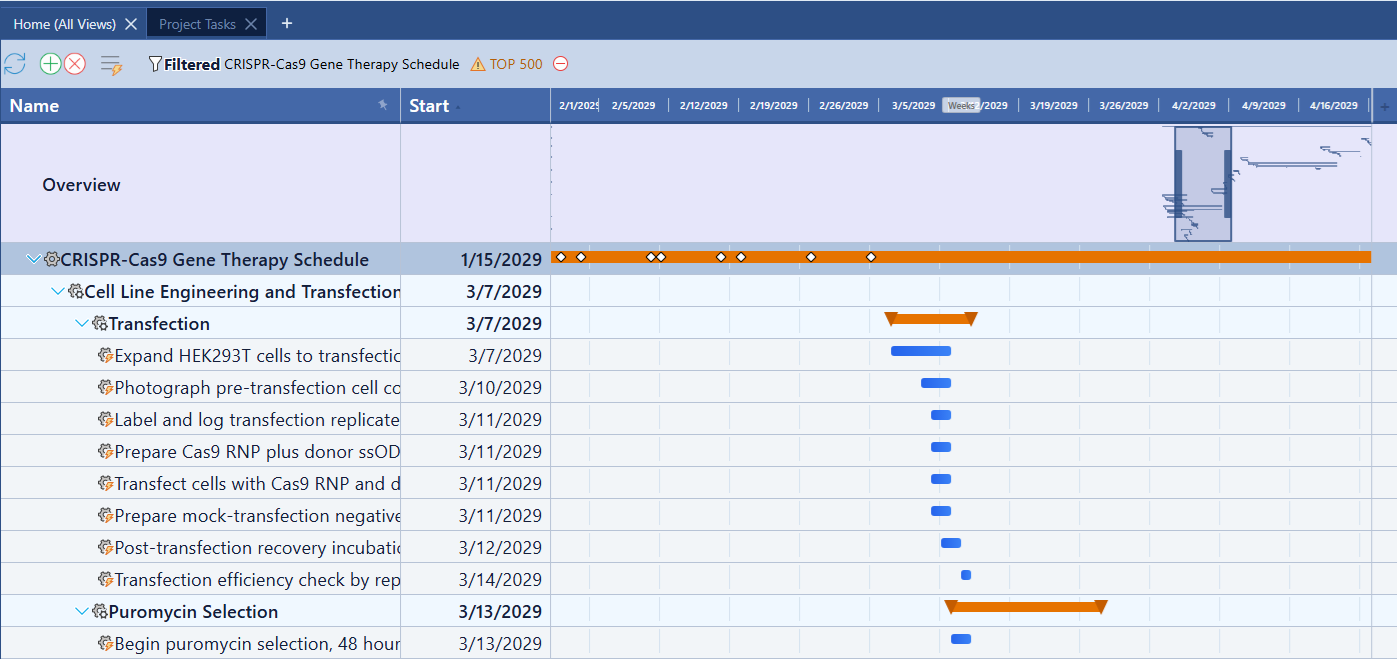
The mini-map is labeled "Overview" and sits as its own row, pinned in place — it never scrolls off screen no matter how far down the task list you go. Inside its Gantt cell, every other row's task is drawn as a thin colored bar, scaled to fit the column's own pixel width against the project's earliest start and latest finish date. The result reads as a miniature of the full Gantt column: scroll down the grid, and you can scan down the mini-map's bars in the same top-to-bottom order to see roughly where you are.
A vertical line marks today's date on the compressed strip, using the same visual language as the real Gantt's own today marker. And superimposed on top of the bars is the viewport rectangle — a bordered window showing exactly which portion of the timeline the real Gantt chart is currently displaying below it.
Turning It On
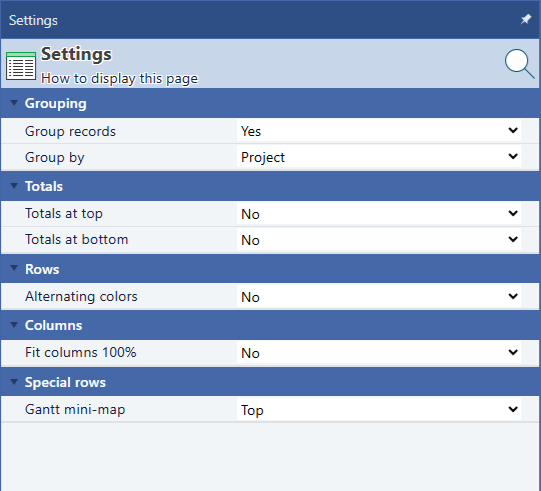
The mini-map is off by default. To enable it, open the Settings panel for a Gantt-capable grid and look for the Special rows category near the bottom — the same place grouping, totals, and column options live. The Gantt mini-map setting is a three-way dropdown:
- No — the default. No overview row is shown.
- Top — the overview row is pinned directly under the column headers.
- Bottom — the overview row is pinned to the bottom edge of the grid instead.
The choice is per-grid and persists across page reloads, so a Task/Gantt view configured with the mini-map at Top stays that way the next time you open it. If a grid's data has no Gantt column at all — a plain list view, for instance — turning the setting on is simply a no-op; there's nothing to show an overview of.
Reading the Overview Row
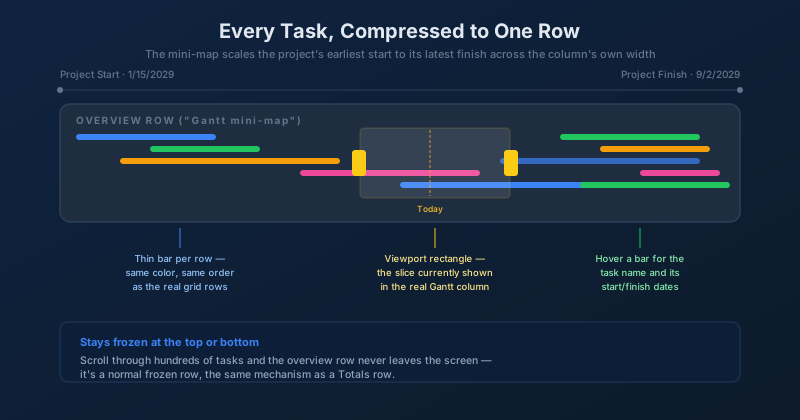
Each compressed bar keeps the same color as its task's real Gantt bar, and hovering over one shows a tooltip with the task's name and its start and finish dates — useful for spotting a specific phase in the strip without leaving the compressed view. Because the mini-map draws from every other row's own Gantt data already loaded in the grid, no extra request goes to the server to build it; it's assembled entirely from what's already on the page.
The viewport rectangle is the part that makes the row interactive rather than purely decorative. Its left edge, width, and position are all derived from the real Gantt's current scroll position and zoom level, so as you pan or zoom the chart normally — using the nav-scroll arrows, the scale-zoom drag, or the mouse — the rectangle updates to match. The reverse is also true, and it's the more useful direction: drag the rectangle itself, and the real Gantt chart follows it.
Panning and Resizing the Viewport
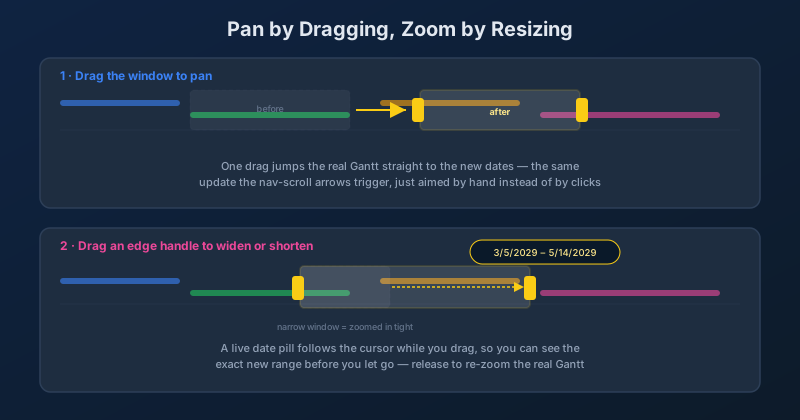
Grab anywhere inside the highlighted window and drag left or right to pan. Nothing changes on screen until you release the mouse — the drag itself only moves the rectangle within the mini-map's own bounds — but on drop, the real Gantt chart jumps straight to the new dates, the same discrete "go look over there" update the nav-scroll arrows already perform, just aimed by hand instead of by repeated clicks.
Two small handles sit on the left and right edges of the viewport rectangle for resizing it independently of the pan drag:
- Drag the right handle outward to widen the window — this zooms the real Gantt chart out, showing more calendar time on screen, while the window's left edge (its start date) stays fixed.
- Drag the left handle outward to widen the window from the other side — this also zooms out, but keeps the window's right edge (its finish date) fixed and moves the start date earlier instead.
- Drag either handle inward to shorten the window and zoom in tighter on that portion of the schedule.
While a resize is in progress, a small pill follows the cursor showing the exact start and finish dates the window would land on if you released right now — so you can fine-tune the range before committing. Letting go re-zooms the real Gantt chart to match, and the new pixels-per-day scale is saved the same way any other zoom-level change is, so it's still there the next time the grid loads.
Keyboard Navigation
Click the mini-map's Gantt cell to select it, then use the Left/Right arrow keys to nudge the real Gantt view one increment at a time — the identical scroll the nav-scroll arrow buttons perform. Hold Shift while pressing an arrow key for a bigger, page-sized jump instead of a single-increment scroll. Holding either key down repeats the nudge automatically after a short delay, at a controlled, steady pace, so a long hold pans smoothly instead of firing a flood of updates all at once.
Works on Every Gantt-Capable View
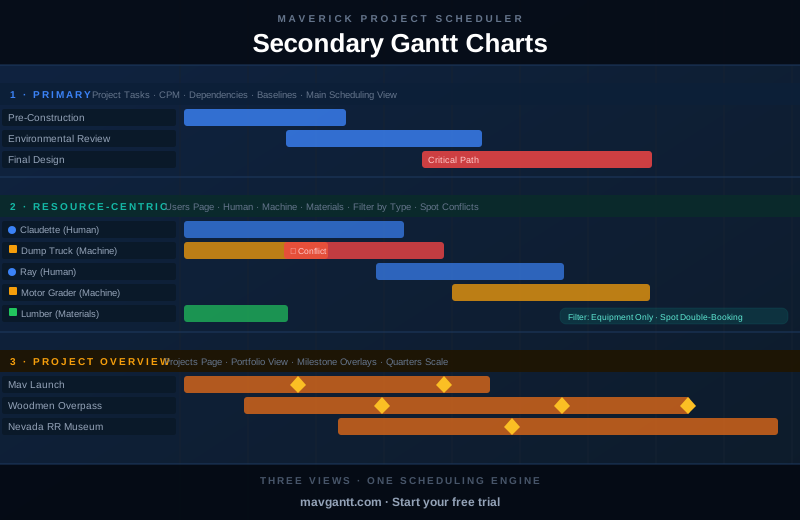
The mini-map isn't limited to the Project Tasks grid. Because it's built generically against any grid whose underlying data includes a Gantt column, it's available on the Projects view (portfolio-level overview), the Subprojects view, and the resource-centric Users Gantt described in Secondary Gantt Charts — each gets its own independent Top/Bottom/No setting, so a schedule-heavy Task view and a lighter Projects portfolio view can be configured differently to match how each one is actually used.
On the Project Tasks grid specifically, the mini-map can be pinned right alongside a second frozen row — the Team Capacity resource-allocation strip — so schedule overview and workload both stay visible at once. See Stacking Frozen Rows: Gantt Mini-Map + Team Capacity for how they work together.
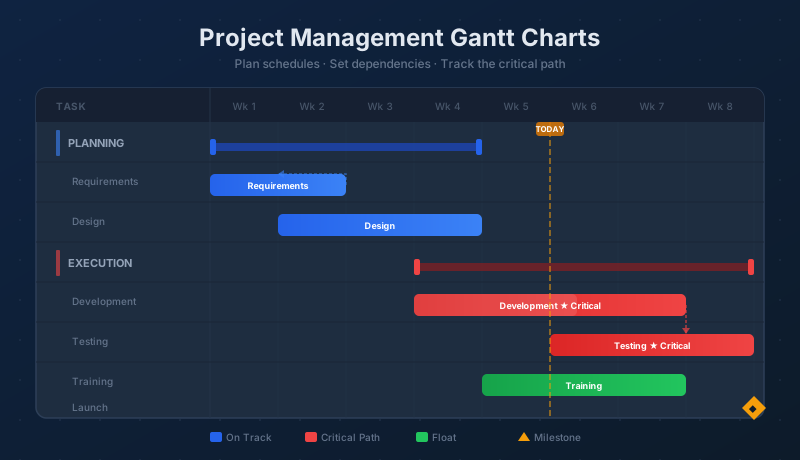
For the fundamentals of the Gantt chart itself — task bars, dependencies, the critical path, and how to navigate the column day to day — see the full Project Management Gantt Charts guide.
Stop Losing Your Place on Long Schedules
Start a free cloud trial, turn on the Gantt mini-map from Settings, and see your whole project compressed into one draggable strip — no more scrolling blind to find where you are.
Access the Free Cloud Trial