
Maverick Project Scheduler has one primary Gantt chart — the project tasks view — and two secondary Gantt charts that offer different perspectives on the same data: the resource-centric Gantt and the project overview Gantt. Most scheduling work happens in the primary view, but the secondary charts are valuable tools for analysis, filtering, and conflict detection that the task view alone cannot provide.
These secondary views don't replace the primary Gantt. They draw from the same underlying project data and present it from a different angle — one focused on resources, one focused on entire projects. Understanding when to switch views can significantly speed up your ability to spot problems and make informed scheduling decisions.
The Primary Gantt: Project Tasks
The project tasks Gantt is Maverick's main scheduling view. This is where you build and edit schedules — setting task dates, creating dependency links, assigning resources, and tracking progress against the plan.
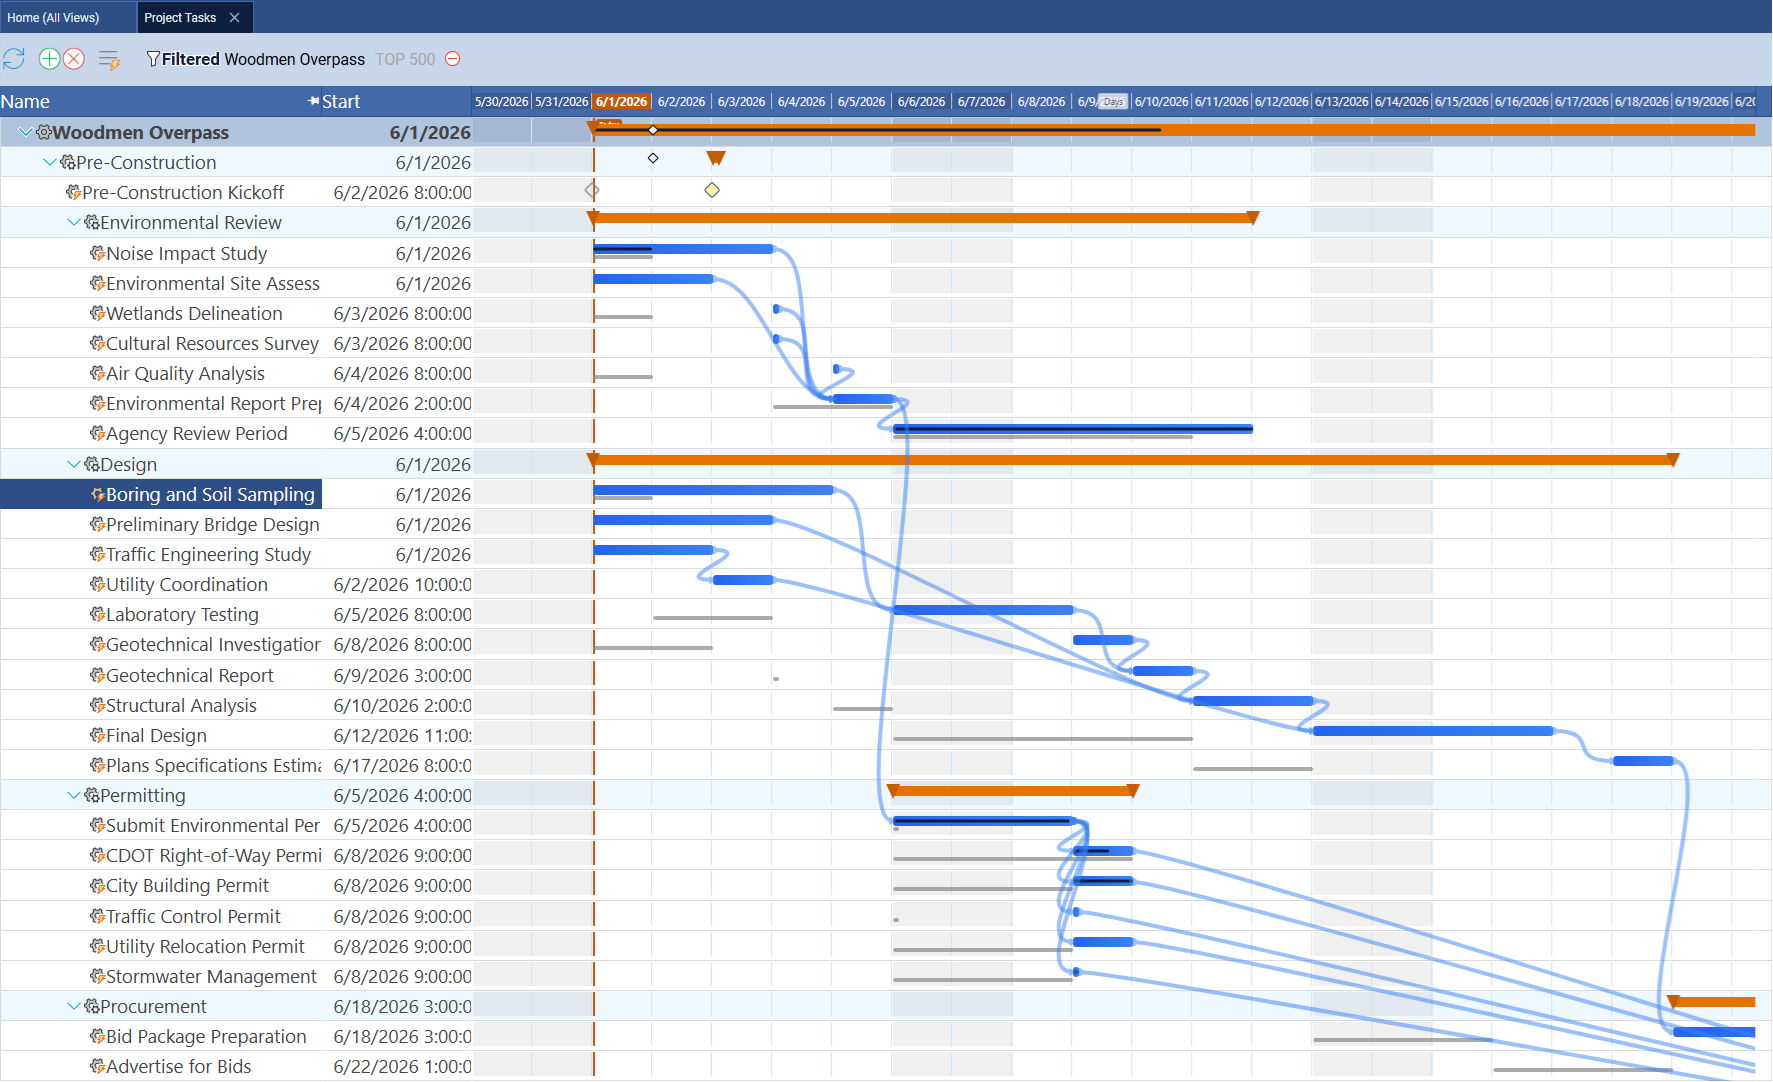
The task Gantt shows individual tasks as rows, each with a start date on the left and a horizontal bar on the timeline representing its duration. Dependency link lines connect tasks that are sequenced by finish-to-start, start-to-start, finish-to-finish, or start-to-finish relationships. Critical path tasks are highlighted in red — any delay to them delays the entire project. If a baseline has been captured, thin gray ghost bars appear behind the current task bars, showing where each task was originally scheduled.
When you need to change task dates, adjust dependencies, check the critical path, or compare actual progress against the baseline plan, the project tasks Gantt is where you work. The two secondary views described below show the same underlying data differently — they are not for editing, they are for seeing something the task view doesn't show as clearly.
For a complete guide to the primary task Gantt — all four dependency link types, critical path, baselines, and navigation controls — see Project Management Gantt Charts.
Secondary View 1: The Resource-Centric Gantt
The resource-centric Gantt is accessed from the Users page. Where the primary Gantt shows project tasks as rows, this view shows resources as rows — human team members, machines, and materials. Each horizontal bar on a resource's row represents one task assigned to that resource. You can see every task currently committed to a specific person or piece of equipment, laid out on a timeline.
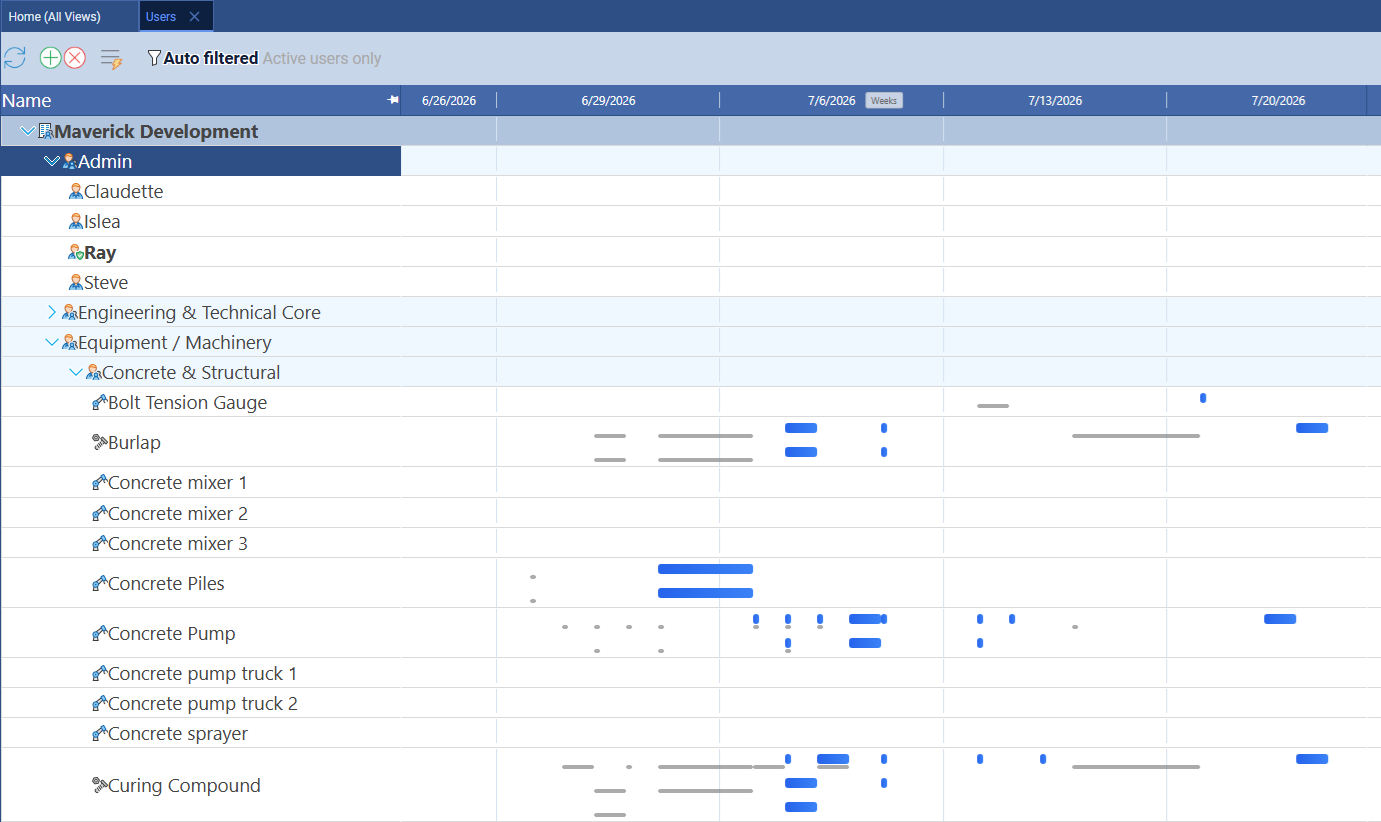
This view spans all active projects simultaneously. If a team member is assigned to tasks across three different projects, all of those tasks appear as bars on their row — sorted by date, side by side. This gives you a complete picture of any resource's total commitment across your portfolio, not just within the project you happen to have open.
The resource-centric Gantt works for all three resource types. Human team members, machines like excavators and dump trucks, and material resources all appear in their own rows. You can filter the view to show only a specific resource type — equipment only, for example — to narrow your focus when analyzing a particular category of resource.
What to Look for in the Resource-Centric Gantt
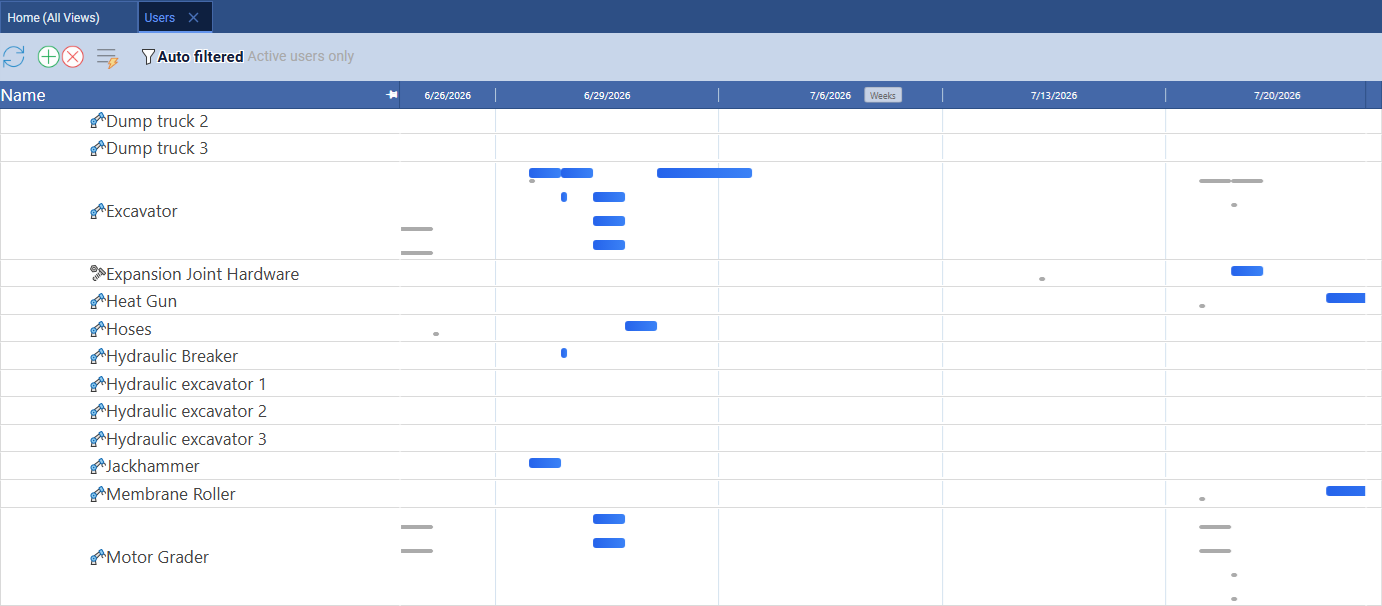
Filtering to equipment only makes it easy to scan for machine scheduling problems at a glance. The same analysis works for human resources. Here is what to look for:
- Overlapping task bars — two bars that overlap on the same resource row mean that resource is double-booked: two separate tasks claim the same person or machine during the same time window. This is the most important conflict to catch, because it is invisible in the project task Gantt if the two tasks are in different projects.
- No-gap stretches — a resource with continuous bar coverage, task after task with no breaks, may be effectively over-scheduled without any single pair of tasks technically overlapping. Look for resources where the bars run edge to edge across weeks.
- Long empty spans — a resource row with a large block of empty timeline is under-utilized. This may signal a staffing gap, a scheduling opportunity, or a resource that has been forgotten in the current plan.
- Where commitment ends — the last bar on any resource's row is where their current scheduled work ends. Everything to the right of that bar is available capacity. This is useful when you need to know when a specific piece of equipment or team member becomes free to take on new work.
This view pairs directly with the resource allocation bar chart, which shows utilization as color-coded percentages. The bar chart tells you how over-loaded a resource is; the resource-centric Gantt shows you which specific tasks are creating that overload. Use both for a complete picture.
Secondary View 2: The Project Overview Gantt
The project overview Gantt is available from the Projects (Home) page. Where the primary task Gantt shows individual tasks within a single project, the project overview Gantt shows entire projects as rows. Each bar represents one project's complete timeline — its start date to its finish date. Milestone diamonds are overlaid on each project bar at the dates where key deliverables are scheduled.
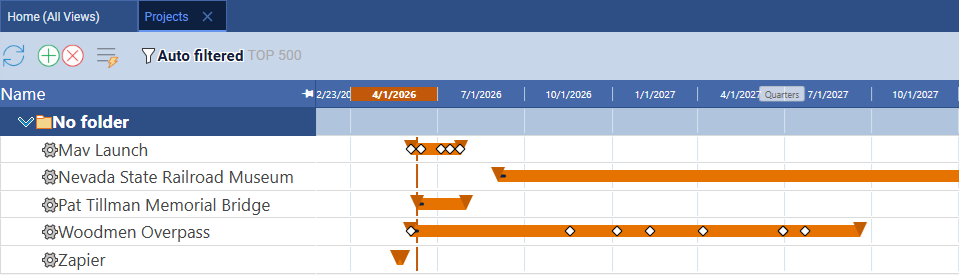
The timeline scale on the project overview Gantt typically runs at the quarters level — broad enough to show all active projects on one screen. You can see at a glance which projects are running simultaneously, when each starts and ends relative to the others, and where major milestones fall across the calendar. A cluster of milestones in the same week is immediately visible here in a way that is difficult to see when looking at individual project task Gantts one at a time.
Unlike the primary task Gantt and the resource-centric Gantt, the project overview Gantt operates at the project level, not the task level. You can review the portfolio and identify scheduling patterns, but you cannot edit individual tasks from this view. Use it for context and communication — to brief a stakeholder on the full project portfolio, or to identify which quarter has the heaviest project load before committing a new project to that period — then open a specific project and switch to the task Gantt to make changes.
Which View Should You Use?
All three views draw from the same underlying project data. The question is which perspective answers the question you are trying to answer:
- Use the project tasks Gantt when you are building or editing a schedule — setting task dates, creating or adjusting dependencies, assigning resources to tasks, tracking the critical path, or comparing current progress against the baseline plan. This is the primary working view.
- Use the resource-centric Gantt when you want to understand a specific resource's workload across all projects — to check whether a team member or machine is double-booked, see when their commitments end, or filter to one resource type and scan the full portfolio for conflicts.
- Use the project overview Gantt when you want a portfolio perspective — to see how multiple projects relate to each other on the calendar, where milestones cluster across active projects, or to prepare a high-level briefing without opening individual project files.
For a deeper look at the primary Gantt — CPM, all four dependency types, baselines, and the full task view — see Project Management Gantt Charts. For the resources tracked in the resource-centric view — human, machine, and materials — see Human, Machine, and Material Resources.
See All Three Views in Action
Start a free cloud trial and open all three Gantt views — use the task Gantt to build your schedule, the resource-centric Gantt to spot conflicts across your team and equipment, and the project overview Gantt to see the full portfolio at a glance.
Access the Free Cloud Trial
