
Scheduling
AI Is Not Required
Maverick is a full-featured project scheduler with over 50 task properties, four dependency link types, resource assignments, and project costing built in. The AI chat feature is an optional add-on — the scheduling engine runs without it.
Try It FreeWhat Does Maverick Include Without AI?
Whether or not you subscribe to an AI provider, Maverick gives you a complete scheduling platform — the same tools used in enterprise project management, in a cloud-hosted system your team can access from anywhere.

The AI chat feature in Maverick lets you describe a change in plain language and have the scheduler apply it automatically. It is a powerful time-saver — but it is entirely optional. Every update the AI can make, you can also make directly in the task grid, Gantt chart, or property panels. The data model is the same either way.
Teams that prefer not to use AI, or who are not ready to set up an API key, can use Maverick as a traditional project scheduler from day one. The task properties, dependency network, resource allocation chart, and cost tracking are all active without any AI configuration.
This guide covers the four core scheduling pillars that make Maverick a complete project management tool — independent of AI.
50+ Task Properties
Each task in Maverick carries over 50 fields covering identity, scheduling, assignment, and cost — enough to model any project with the precision a professional plan requires.

Identity and Status Fields
Every task starts with a name, a unique ID, and an optional work breakdown code that slots it into the project hierarchy. Status fields — Not Started, In Progress, Complete, On Hold — drive dashboard metrics and filter views. A milestone flag converts a zero-duration task into a diamond on the Gantt chart. Priority codes let you sort and filter by urgency. Notes and file attachments keep reference material with the task it belongs to.
Keeping identity fields accurate pays off when you filter the task grid, generate reports, or ask the AI to find a specific task by name — a well-named, correctly-coded task is unambiguous to both humans and the scheduler.
Scheduling Fields
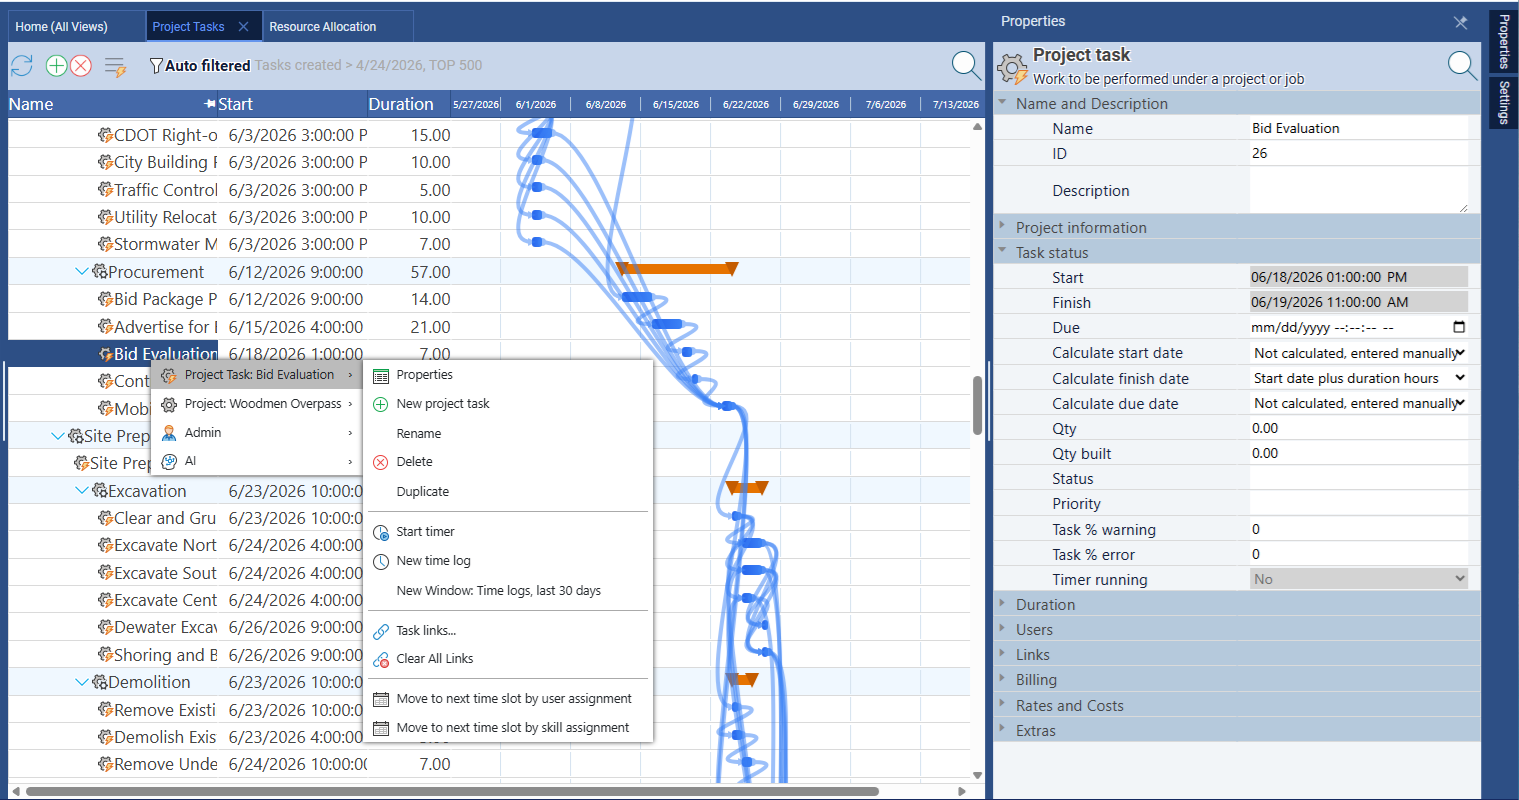
Start date, finish date, and duration are the three fields that place a task on the timeline. Change any one of them and Maverick recalculates the other two based on the task's calculation method. Calculate Start Date and Calculate Finish Date settings let you choose whether a date is driven by its predecessor link or fixed in place by a hard deadline.
Baseline fields store your original plan — baseline start, baseline finish, and baseline duration. As the project runs, Maverick compares current dates to baseline dates and surfaces the variance. Total Float shows how many days a task can slip before it affects the project finish date.
Assignment Fields
Assignment fields connect a task to the people, machines, and materials that do the work. You can assign multiple resources to a single task, each at a different allocation percentage. The Workgroup field organizes resources into team or department groups that appear as collapsible trees in the resource browser panel.
Availability fields constrain when a resource is eligible to work — useful for part-time staff, contractors, or equipment with scheduled maintenance windows. Skill and role tags support competency-based matching when multiple resources could fill a position.
Cost Fields
Maverick tracks three cost values per task: budgeted cost (set during planning), actual cost (accumulates as resources log time or quantities), and remaining cost (what's left to spend). The difference between budgeted and actual is the cost variance — the raw number behind earned-value analysis.
Fixed costs cover expenses not tied to resource billing rates — travel, materials purchases, subcontractor invoices. All cost fields roll up to subproject and project levels automatically, giving you a live budget vs. actual view without building a separate spreadsheet.
For a complete reference of every task field — including data types, valid values, and how each property interacts with scheduling — see Every Project Task Property, Explained.
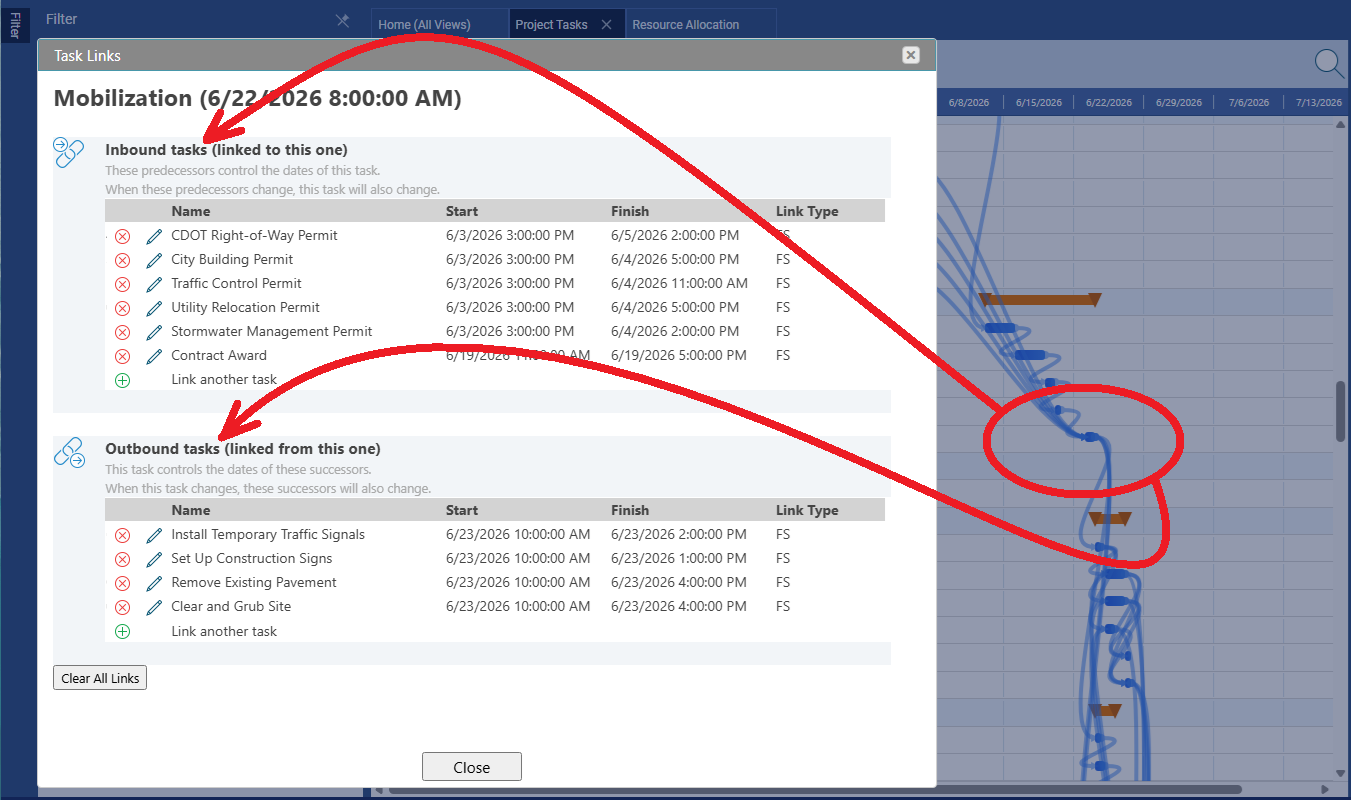
Task Link Relationships
Dependency links are what separate a real schedule from a list of dates. Link two tasks and Maverick enforces the constraint — when a predecessor slips, every downstream successor shifts automatically.
Finish-to-Start (FS)
The most common link type. The successor cannot start until the predecessor finishes. Testing cannot begin until development completes. Framing cannot start until the foundation is poured. FS links build the logical sequence of work that drives the project forward. When you add a FS link, Maverick sets the successor's start date to the day after the predecessor's finish and propagates that date through all downstream tasks.
Finish-to-Finish (FF)
The successor cannot finish until the predecessor finishes. Both tasks can run in parallel — FF constrains only their endings. User documentation must finish when the feature it describes finishes. Defect tracking must close when the testing sprint closes. FF creates convergence points where parallel workstreams must wrap up together.
Start-to-Start (SS)
The successor cannot start until the predecessor starts. SS is used when two activities must begin together — or when one must be underway before the second is useful to begin. Data cleanup can start once data collection begins. Training can start once onboarding begins. Adding lag to an SS link creates a fixed delay between the two start points.
Start-to-Finish (SF)
The successor cannot finish until the predecessor starts. SF is the rarest link type. It models handover situations — the outgoing shift cannot end until the incoming shift has started. The old vendor's contract cannot be terminated until the new vendor's contract is active. SF is useful precisely when the successor must stay open until the predecessor triggers its close.
Lag and Lead
Any link type can carry a lag (positive offset) or lead (negative offset). A FS link with a 2-day lag means the successor cannot start until 2 days after the predecessor finishes — useful for curing time, regulatory cooling periods, or review windows. A FS link with a 3-day lead lets the successor start 3 days before the predecessor finishes, deliberately overlapping the two tasks to compress the schedule.
Critical Path
Once your tasks are linked, Maverick calculates the critical path — the longest chain of dependencies from project start to project end. Every task on the critical path has zero float. A one-day slip to any critical task moves the project finish date by one day. Maverick highlights critical path tasks in red on the Gantt chart so you can see at a glance where schedule risk is concentrated.
Float and Slack
Tasks not on the critical path carry float — a buffer of days they can slip before affecting the project end date. The Total Float field shows this value per task. Float lets you prioritize: in a resource conflict, shift effort from a task with 10 days of float to a zero-float task without moving the delivery date. Maverick exposes float in both the task grid and the Gantt chart.
For a deep dive into all four link types and how Maverick visualizes them as Gantt arrows, see Task Link Relationships.
Resource Assignments
Resources are the people, machines, and materials that do the work. Assigning them to tasks connects the schedule to real-world capacity — and unlocks cost tracking and the allocation bar chart.
Three Resource Types
Human resources are the people doing the work — employees, contractors, or any named individual. They carry billing rates, availability schedules, skills, and workgroup membership. Human resources are the ones that can appear on the allocation bar chart as over-allocated (red), correctly allocated (green), or under-allocated (amber).
Machine resources are equipment: cranes, servers, vehicles, lab instruments. Like human resources they have daily costs and can be assigned to multiple tasks — Maverick flags overloaded equipment the same way it flags overloaded people.
Material resources are consumables measured by quantity rather than time: concrete, software licenses, raw materials. They have a unit cost rather than a billing rate, and their cost accumulates by units consumed rather than hours logged.
Allocation Bar Chart
The resource allocation bar chart shows every resource's workload across the project timeline — one row per resource, one column per time period. Color coding makes imbalances visible at a glance: green bars are correctly allocated, amber bars are under-allocated (the resource has spare capacity), and red bars flag over-allocation where more work is assigned than the resource can absorb in the available hours.
When you spot a red bar, you can resolve it by reassigning some tasks to a different resource, extending durations, adjusting allocation percentages, or shifting task dates to distribute the load more evenly. No AI is needed to read the chart or make these adjustments — the bar chart is a standard Maverick view available to all users.
Workgroup Organization
Resources belong to workgroups — departments, teams, or organizational units. Workgroups appear as collapsible trees in the resource browser, making it easy to navigate large organizations and find the right person for a task. You can filter the allocation bar chart by workgroup to focus on one team's capacity without displaying every resource in the company.
Availability Schedules
Each resource has an availability schedule that defines which days and hours they are eligible to work. A resource set to 50% availability works half days; one with a fixed start date is not available for earlier tasks; one with a blackout period cannot be assigned work during planned leave or maintenance windows. Maverick uses availability schedules when calculating whether a task's resource load is feasible in the time allotted.
For details on resource fields, workgroup setup, and how the allocation chart is calculated, see Resource Types: Human, Machine, and Materials and The Resource Allocation Bar Chart.
Project Costing
Cost tracking in Maverick flows from resource billing rates and material unit costs through tasks, subprojects, and up to the project total — no separate spreadsheet needed.
Budget vs. Actual
Every task carries a budgeted cost set during planning and an actual cost that accumulates as work is recorded. The variance between them — budgeted minus actual — is visible at the task level, subproject level, and project total. Favorable variance means you are spending less than planned; unfavorable variance means costs are running over budget. Maverick updates these numbers in real time as resource hours and material quantities are entered.
Billing Rates and Unit Costs
Human and machine resources carry billing rates — typically an hourly or daily cost. When you assign a resource to a task, Maverick multiplies the billing rate by the hours assigned to calculate the budgeted cost contribution from that resource. Material resources carry a unit cost instead: a quantity times a cost per unit. You can override the calculated cost with a fixed cost if the task has a negotiated price that doesn't follow the rate schedule.
Earned Value
Earned value analysis combines schedule progress and cost performance into a single picture. Maverick calculates earned value per task as the budgeted cost multiplied by the percentage complete — what the work done so far should have cost according to the plan. Compare earned value to actual cost and you get cost performance index; compare it to planned value and you get schedule performance index. Both metrics are in the task property panel for any task that has a budgeted cost and a recorded percentage complete.
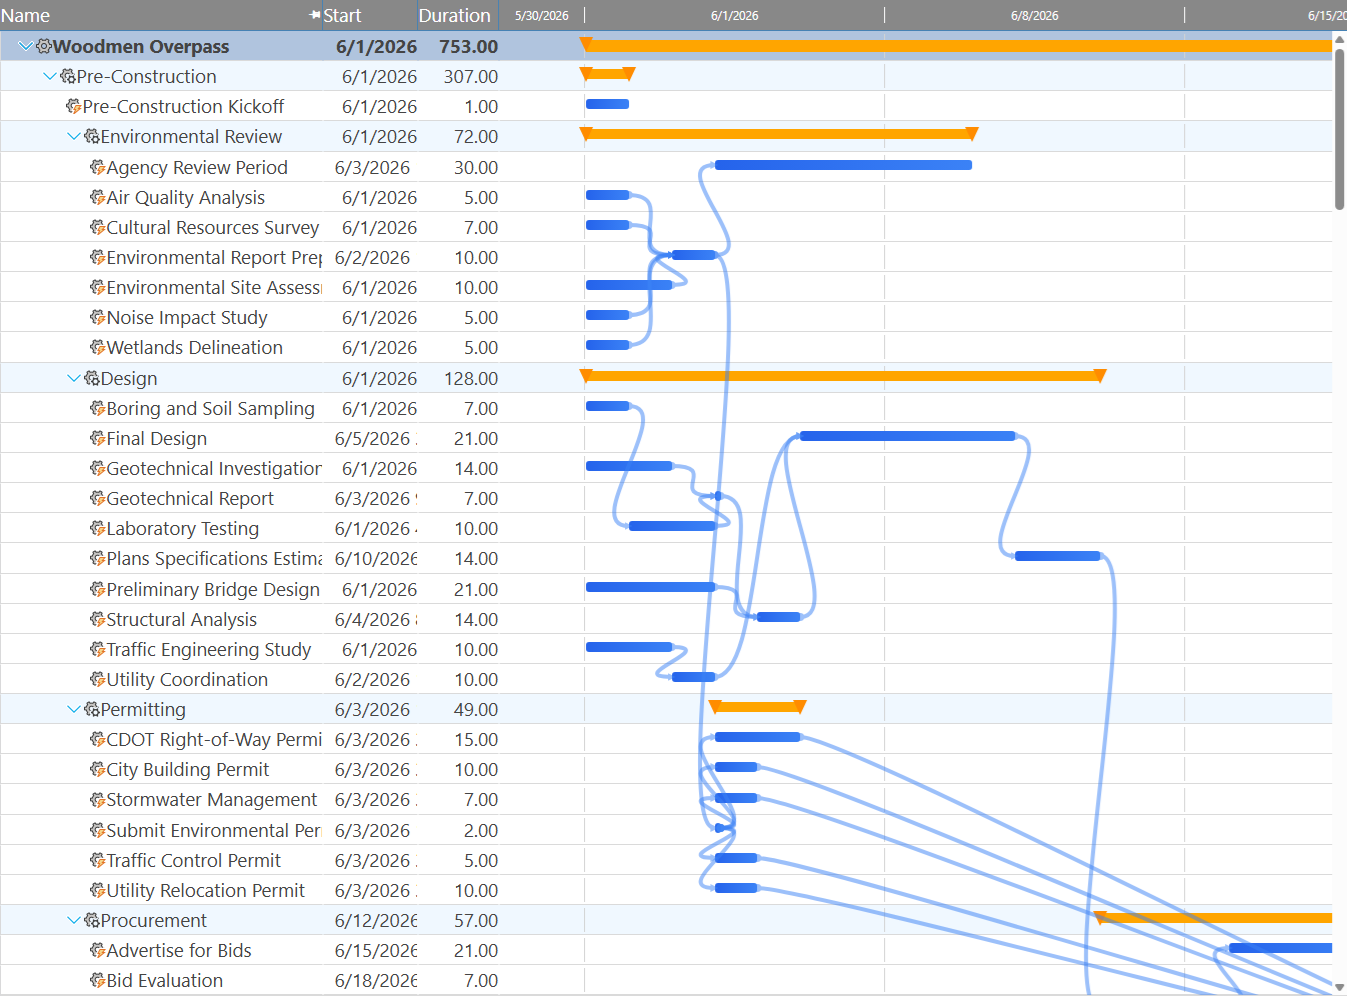
The Gantt Chart
The Gantt chart is Maverick's primary view — task bars on a timeline, sorted and filtered the way you need them, with dependency arrows drawn automatically from your link relationships.
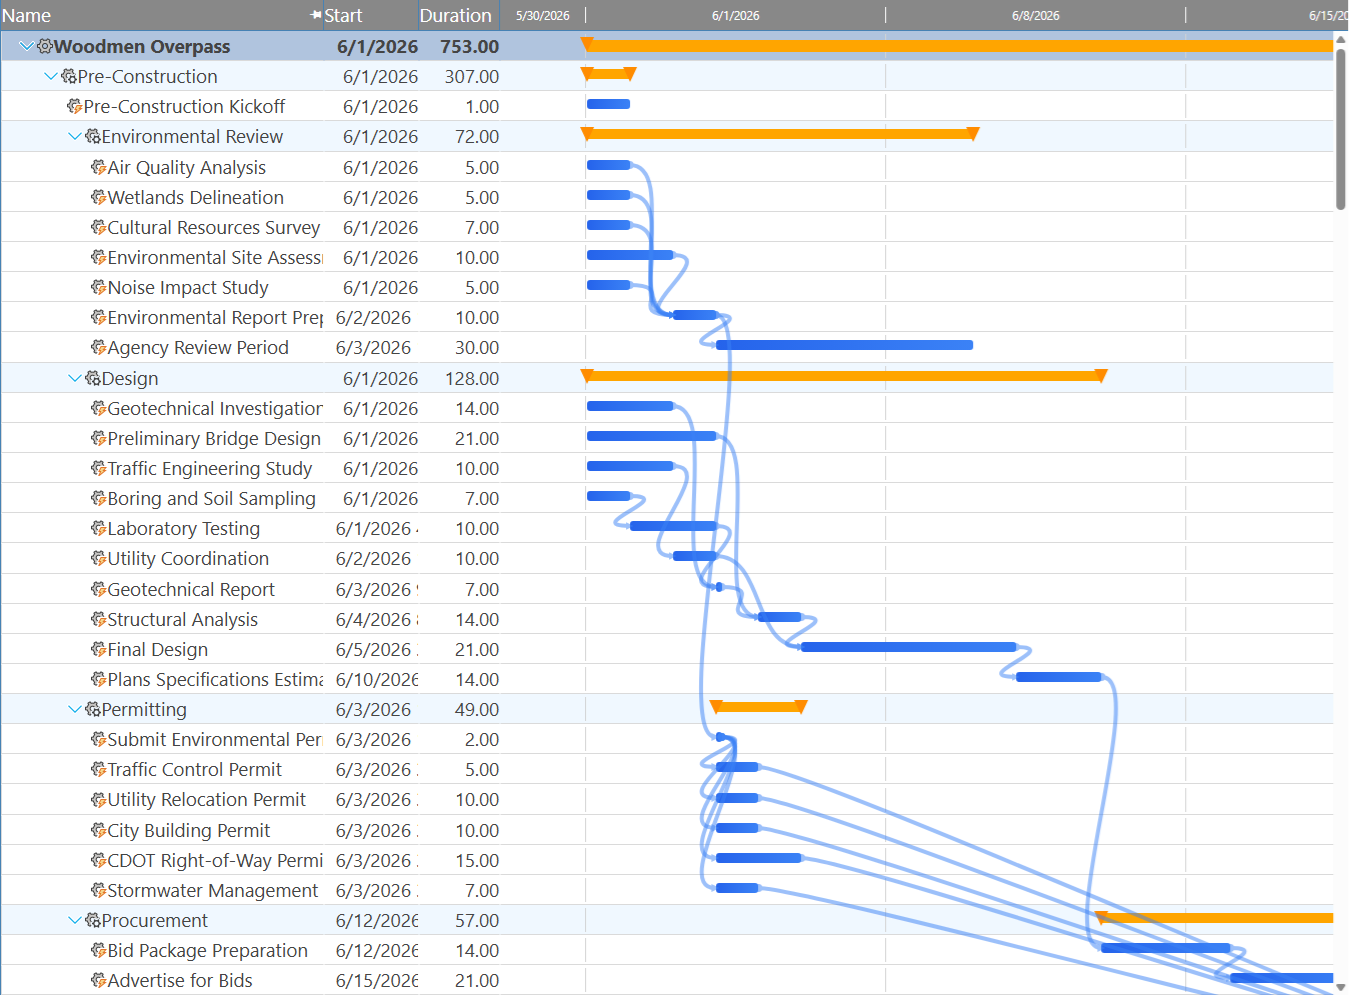
Sort and Filter
The task grid on the left side of the Gantt can be sorted by any task field — name, start date, finish date, duration, status, cost, or any custom field. Filter views let you narrow the grid to a specific subproject, resource, status value, or date range. The Gantt chart on the right updates to match whatever the task grid shows, so you can focus on a single workstream without scrolling through the full project.
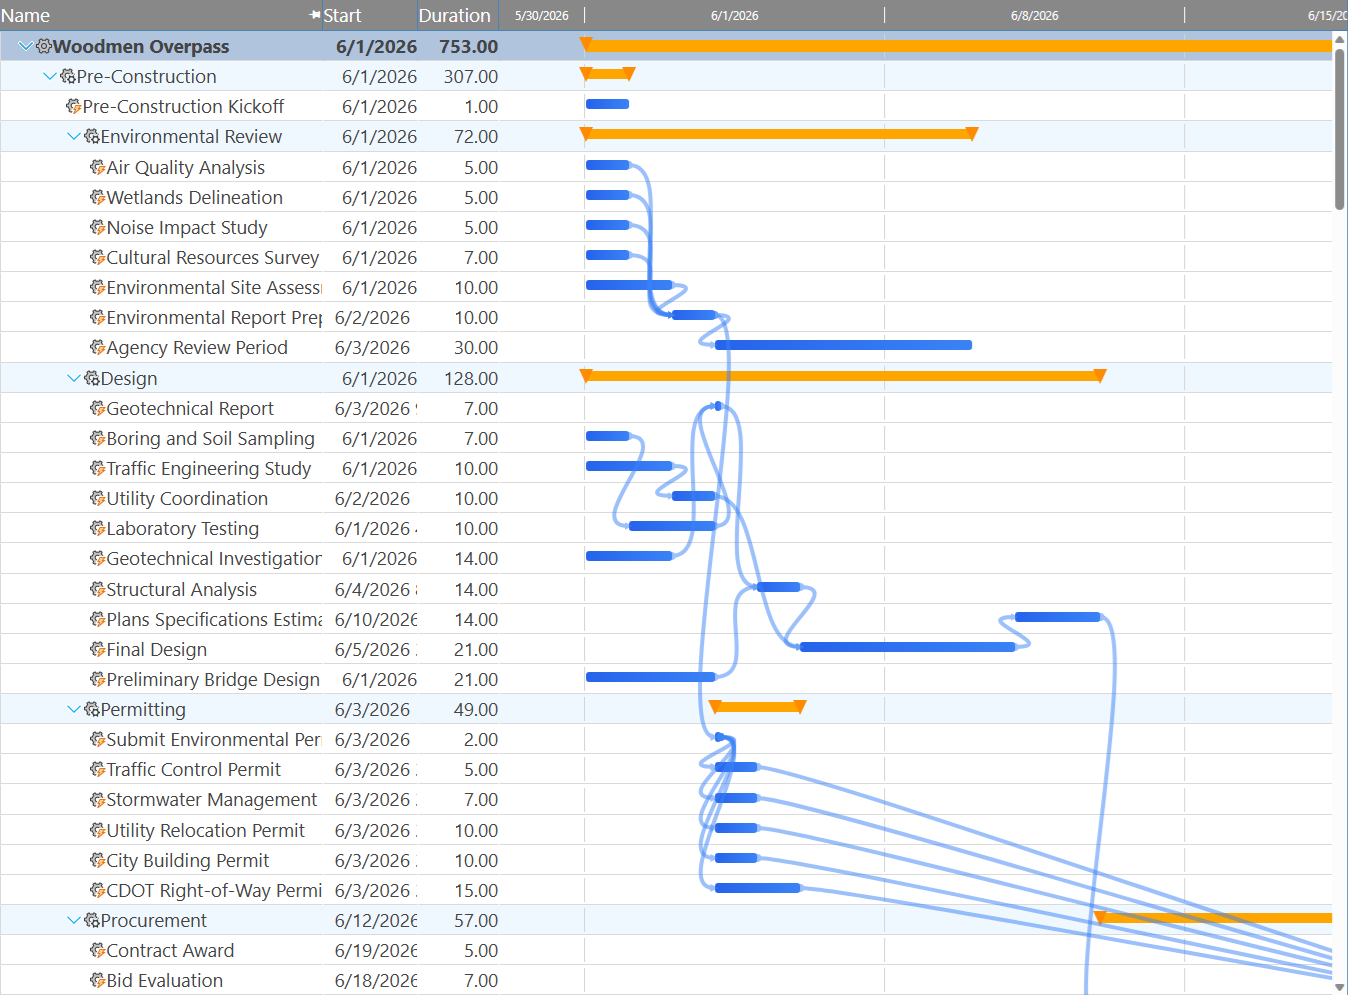
Common sort modes include sorting by start date (to see what's coming up in sequence), by duration (to identify the longest tasks), and by resource (to see one person's entire workload at once). Screenshots below show the Gantt sorted three different ways.
Dependency Arrows
Maverick draws a dependency arrow for every task link in the project. The arrow starts at whichever end of the predecessor triggers the constraint — the right edge for Finish links, the left edge for Start links — and arrives at the corresponding end of the successor. The arrow's shape and attachment point reveal the link type without opening any property panel.
On a dense Gantt chart, you can trace the longest unbroken chain of arrows from start to end — that is the critical path, and Maverick highlights it in red. Non-critical tasks and their arrows appear in the standard bar color, making the critical path visually distinct even on complex schedules with dozens of tasks.
AI Is Optional — Add It When You're Ready
Nothing about the scheduling engine changes when you add AI. The same task properties, links, resources, and costs are there — AI just gives you a faster way to interact with them.
What AI Adds
The AI chat feature lets you describe updates in plain language — "Push all tasks in the Design phase back by one week" or "Assign Sarah to every task where John is currently assigned" — and Maverick applies them without requiring you to edit each task individually. For large projects with dozens of tasks, AI can dramatically reduce the time needed to respond to scope changes or resource shifts.
Still Under Your Control
When AI proposes a change, Maverick shows you exactly what will be modified before committing anything. You can accept, reject, or edit the proposed changes. The AI operates on the same task properties, links, and resource assignments you manage manually — it does not have a separate data layer or override your decisions. Everything it changes is visible in the same task grid and Gantt chart you use every day.
How to Add AI
AI in Maverick is powered by a third-party AI provider — OpenAI, Anthropic, or another supported service — that you connect using your own API key. There is no AI subscription billed by Maverick directly; you pay your AI provider at their standard rates. Until you configure a provider, the AI chat panel is inactive and everything else in Maverick works normally. Add AI when it makes sense for your team — there is no pressure to do it on day one.
Explore the full reference for every task field, or dive into specific scheduling topics:
Every Task Property, Explained Task Link Relationships Resource Allocation Bar Chart