Oil & Gas Engineering
Project Scheduling Software for Oil & Gas Engineering Teams
A deepwater rig runs $250,000 to $500,000 a day whether it is drilling or waiting on a missing part, so every schedule decision on an oil and gas project carries a dollar figure most industries never see. A hitch-rotation crew, a BOP stack with a 20-week lead time, and a BSEE permit desk that can outrun the drill bit itself don't fit on a generic task list. Maverick schedules the equipment, materials, and rotating crew positions behind an oil and gas project as first-class resources, so the Gantt chart reflects the whole operation — not just labor hours.
Try It FreeThe Oil & Gas Value Chain, Project by Project
The underlying mechanics — subproject hierarchy, dependency links, three resource types, milestones, and baselines — carry across every stage below. What changes is which constraint actually threatens the finish date.
Upstream Exploration & Drilling
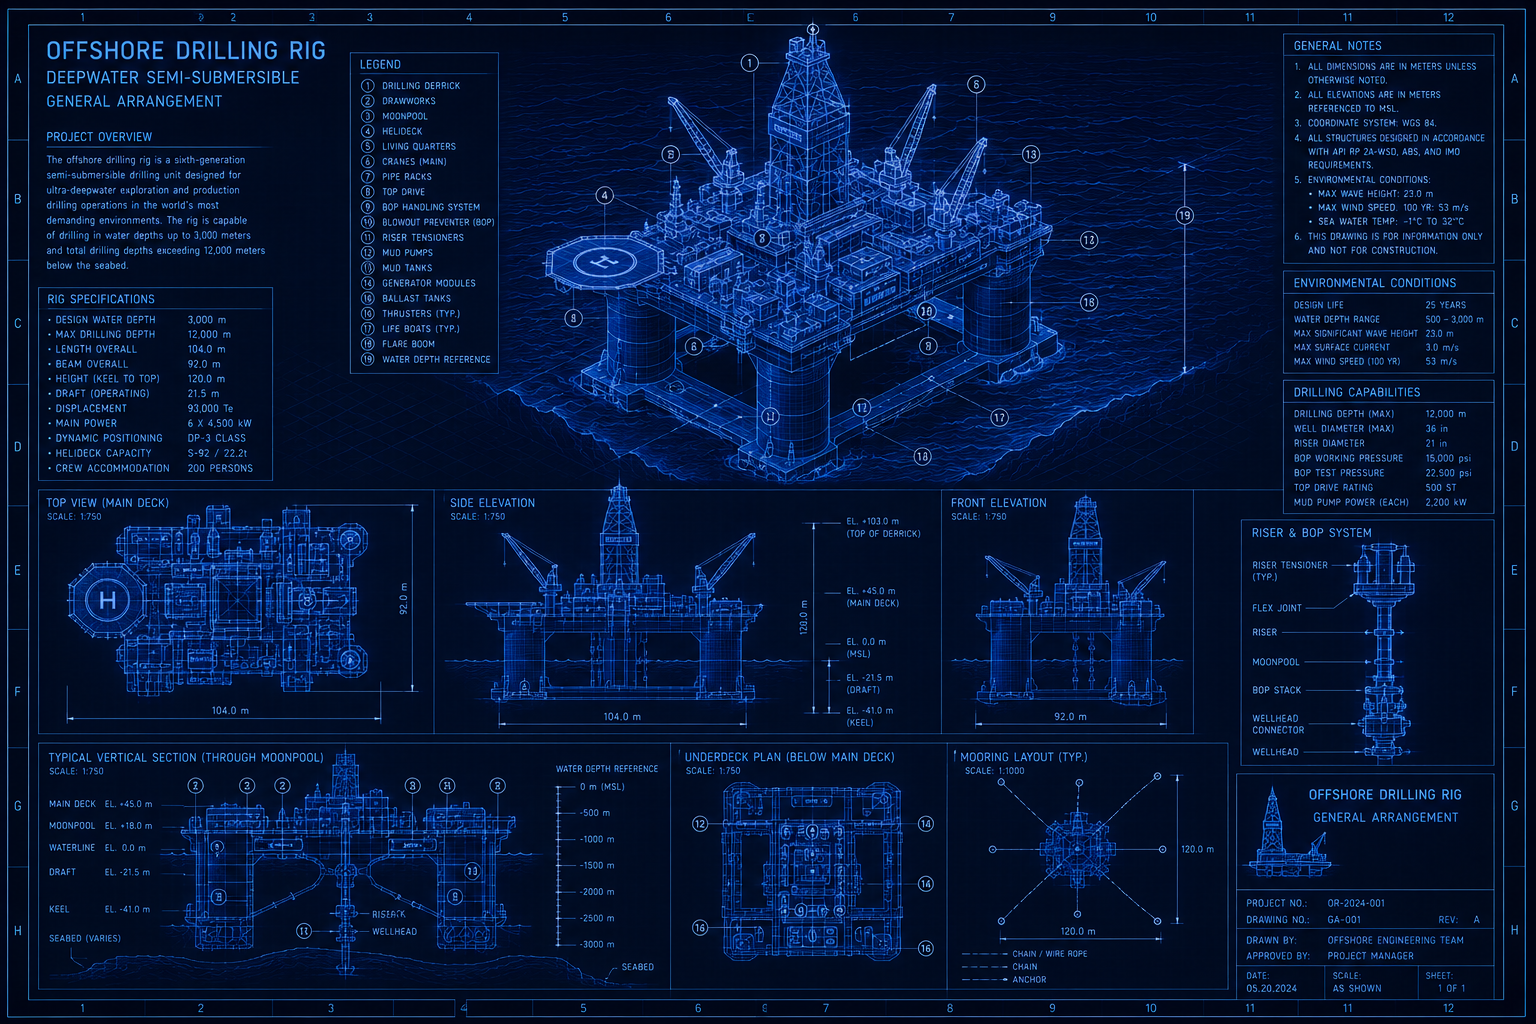
Offshore deepwater campaigns and onshore unconventional/shale pad drilling both run on the same mechanics: a hitch-rotation crew, long-lead BOP and casing procurement, and a wellbore sequence that is physically fixed. The project type behind the blueprint below.
Well Completion & Production Start-Up
Perforation, hydraulic fracturing or stimulation, and well testing lead up to first oil or first gas — tracked as a zero-duration milestone that everything upstream exists to hit and everything downstream, including revenue recognition, starts counting from.
Midstream Gathering & Pipeline Construction
Right-of-way easements, HDD crossings under roads and waterways, and multi-segment tie-ins run as subprojects linked with Finish-to-Start dependencies, so a permitting delay on one easement doesn't silently absorb into the rest of the corridor.
Downstream Refinery Turnarounds & Shutdowns
A planned outage compresses thousands of inspection, repair, and recertification tasks into a two-to-six-week window with a surge of contractor crews. Subproject hierarchy keeps each process unit's task list separate while still rolling up to one turnaround schedule.
Decommissioning & Plug-and-Abandonment
Well plugging sequence, rig-to-reef or removal logistics, and final regulatory closure sign-off are scheduled the same way the original build was — against a locked baseline, with the last milestone gating site release.
Rig Economics Drive Every Scheduling Decision
The daily cost of a drilling rig is unlike any other line item in a capital project — the meter runs whether the rig is drilling, waiting on weather, or waiting on a signature.
| Rig Type | Typical Water Depth | Day Rate Range | Primary Schedule Risk | Cost of a 1-Week Slip |
|---|---|---|---|---|
| Jackup | 0–400 ft | $40K–$120K/day | Wind/wave limits during mat setting | $280K–$840K |
| Semi-Submersible (mid-water) | 400–1,500 ft | $150K–$280K/day | BOP maintenance windows | $1.1M–$2.0M |
| Semi-Submersible (deepwater) | 1,500–10,000 ft | $250K–$500K/day | Procurement lead times; weather downtime | $1.75M–$3.5M |
| Drillship (ultra-deepwater) | 3,000–12,000+ ft | $300K–$600K/day | Station-keeping; riser fatigue management | $2.1M–$4.2M |
| Platform Rig (comparison) | Fixed depth | $15K–$60K/day | Slot availability; existing production interference | $105K–$420K |
At a nominal $320,000/day, a 72-hour slip on a deepwater semi-submersible erases nearly a million dollars before the first barrel is produced — the same math worked through in the offshore drilling blueprint below.
Built for Oil & Gas Scheduling
The same scheduling mechanics, mapped to what actually happens on a drilling campaign, pipeline build, or turnaround.


Critical Path Method
Recalculates as the schedule changes, so a BOP procurement order or a BSEE permit application — not the rig crew — is correctly identified as the actual constraint on the finish date.
Learn about critical pathThree Resource Types
Hitch-rotation crew roles, rig and third-party equipment, and drilling consumables all live on the same resource-centric Gantt chart and get checked for conflicts together.
See resource typesResource Allocation Chart
Flags a Directional Driller or BSEE inspector double-booked across overlapping tasks in red, before that single-person constraint quietly controls the critical path.
See the allocation chartProject Baselines
Locks the plan before spud, with ghost bars proving a 20-week BOP procurement task was in the original plan — not something discovered mid-campaign.
Learn about baselinesAI Chat Project Creation
Describe a campaign in plain language — phases, hitch crew roles, procurement lead times — and AI chat drafts the full schedule for review, the way the blueprint below was built.
See AI chat project creationPer-Employee AI Model Assignment
A drilling engineer running critical path analysis and a company man checking tomorrow's assignments can each run a different AI model — no single account forced on the whole crew.
See AI provider setupSee It in a Real Drilling Campaign Schedule
A worked example, built entirely by AI chat — plus how Maverick compares to the tool oil and gas teams already know.
Deepwater Drilling Campaign — Block 42 Well GC-785
Seven phases from rig mobilization to demobilization, a hitch-rotation crew and BOP stack built as named resources through AI chat alone, a Finish-to-Finish tie-in pinning BOP and riser pressure tests together, and a critical path that runs through a permit desk and a purchase order as often as it runs through the drill bit.
Walk Through the BlueprintHow Maverick Compares to the Incumbent
Maverick vs. Primavera P6 Professional
How Maverick's cloud scheduling compares to the tool most upstream operators and drilling contractors already run, on critical path, resources, and cost of ownership.
Read the comparisonMaverick vs. Primavera P6 EPPM
How Maverick compares to P6 Enterprise for operators running a multi-well drilling program or a portfolio of pipeline and turnaround projects.
Read the comparisonReport on the Schedule Without a Maverick Login
Operating partners, financiers, and regulators usually want status outside the scheduling tool itself.
Power BI Dashboards
Build schedule health, Gantt timeline, and milestone dashboards from live Maverick project data, so a partner or regulator can check drilling or turnaround status without a login.
See the Power BI dashboardsLive OData Feed
Pull projects, tasks, resources, and costs directly into Power BI, Excel, or any OData v4 client via the built-in feed — all 11 entity sets documented with ready-to-paste M queries.
See the OData schema referenceCommon Questions From Oil & Gas Engineering Teams
What drilling contractors, EPC teams, and operators ask before switching their scheduling.