Project Kickoff
This blueprint builds the schedule for the Aransas Bay Desalinization Facility — a fictional 2 MGD (million gallons per day) coastal plant in South Texas. Unlike a solar or construction project where the critical chain runs entirely through physical work sequences, this schedule has two constraints that look harmless in the task list but control everything downstream: a state permit that must clear before any ground is broken, and a two-day procurement task with a 14-week delivery window attached. Lose track of either and the water district board — which approved a fixed service-start date in the public contract — gets a variance report it did not anticipate.
The plant uses horizontal directional drilling to sink a 450-foot intake bore through estuarine beach sediment, using the sand layer as a natural biofilter instead of an open-ocean intake. That engineering choice makes Phase 2 the longest and most schedule-sensitive construction phase. It also makes resource planning more complex than a typical civil project: you have five distinct trade crews who rotate through the site in overlapping sequences, a commissioning engineer who is the single-point constraint during RO membrane loading, and two mechanical systems in Phase 5 that share a final bolted connection and cannot independently close out — a Finish-to-Finish dependency you will wire in Phase 3.
You will practice three dependency link types (FS, SS+lag, and FF), five trade crew resources plus materials, a regulatory baseline, AI-assisted delay analysis, and project costing for a public contract with mandatory milestone reporting.
Step 1: Permits First, Everything Else Waits
This project has two permits that are predecessors to all physical work. Enter both in Phase 1 and wire them as blockers before anything else — the TCEQ construction permit gates HDD mobilization, and the EPA NPDES permit governs brine discharge at commissioning. Getting those links in the Gantt from the start means the critical path calculation will show the permit timeline honestly.
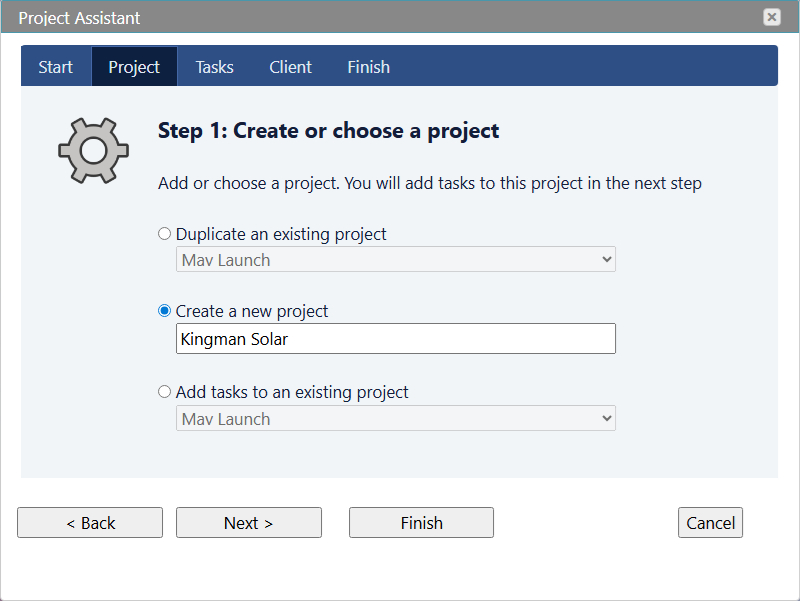
- Home → Project Assistant → Create a project
- Project name: Aransas Bay Desalinization Facility — 2 MGD
- Click Next and enter the 7 construction phase names at the first indent level: Site Preparation & Permits, Subsurface Intake Installation, Raw Water Pumping System, Pre-Treatment System, RO Membrane System, Post-Treatment & Distribution, Testing & Commissioning
- Click Save and Close to open the project in the Gantt chart
- Add subtasks via the Tasks property in the right-hand Properties panel — indent under each phase name
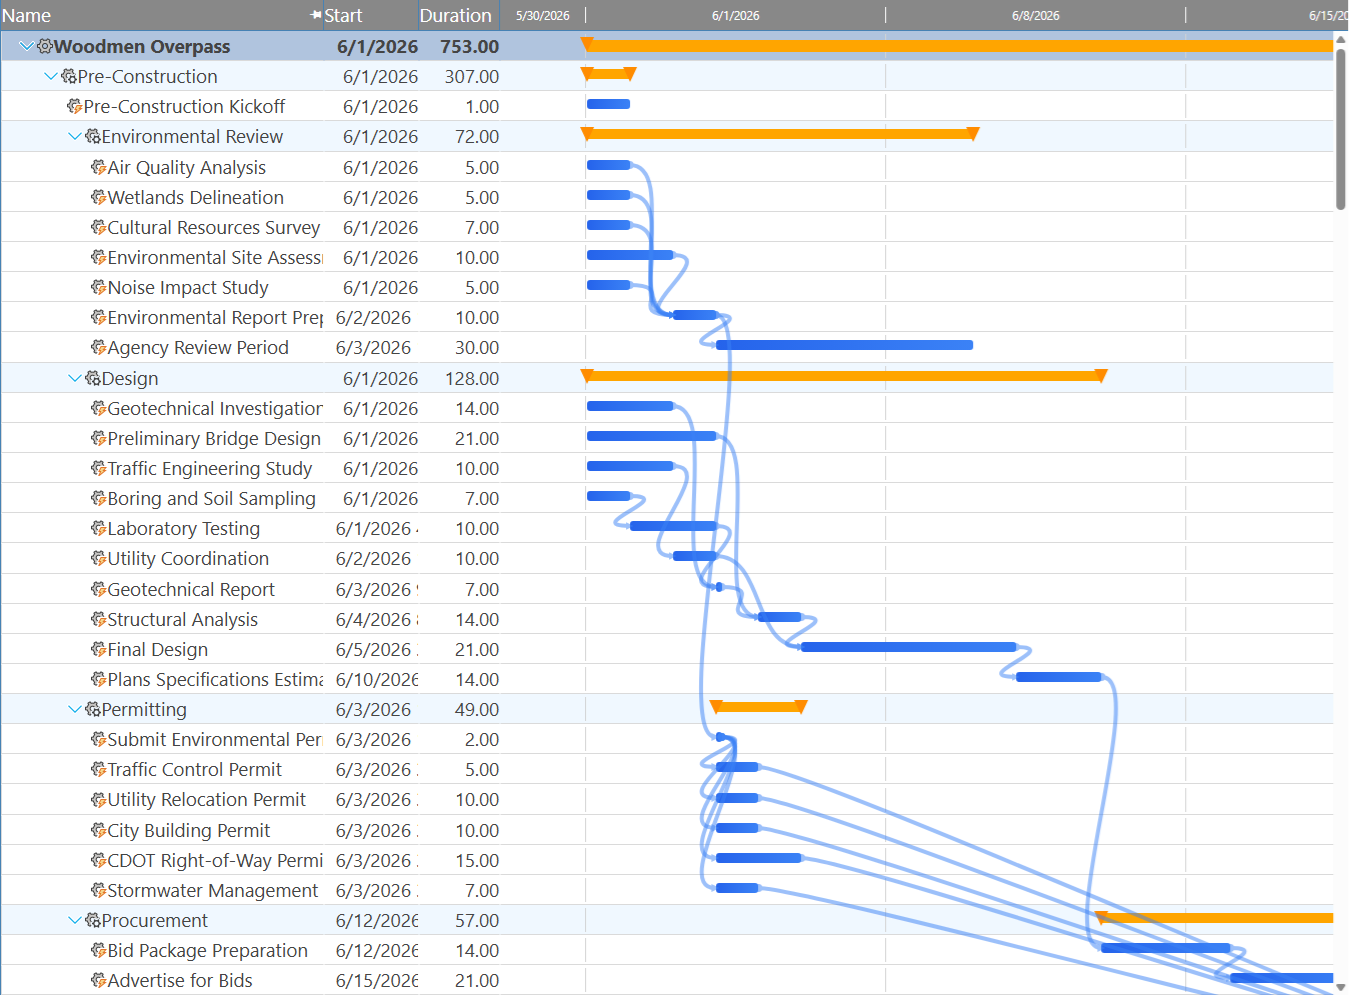
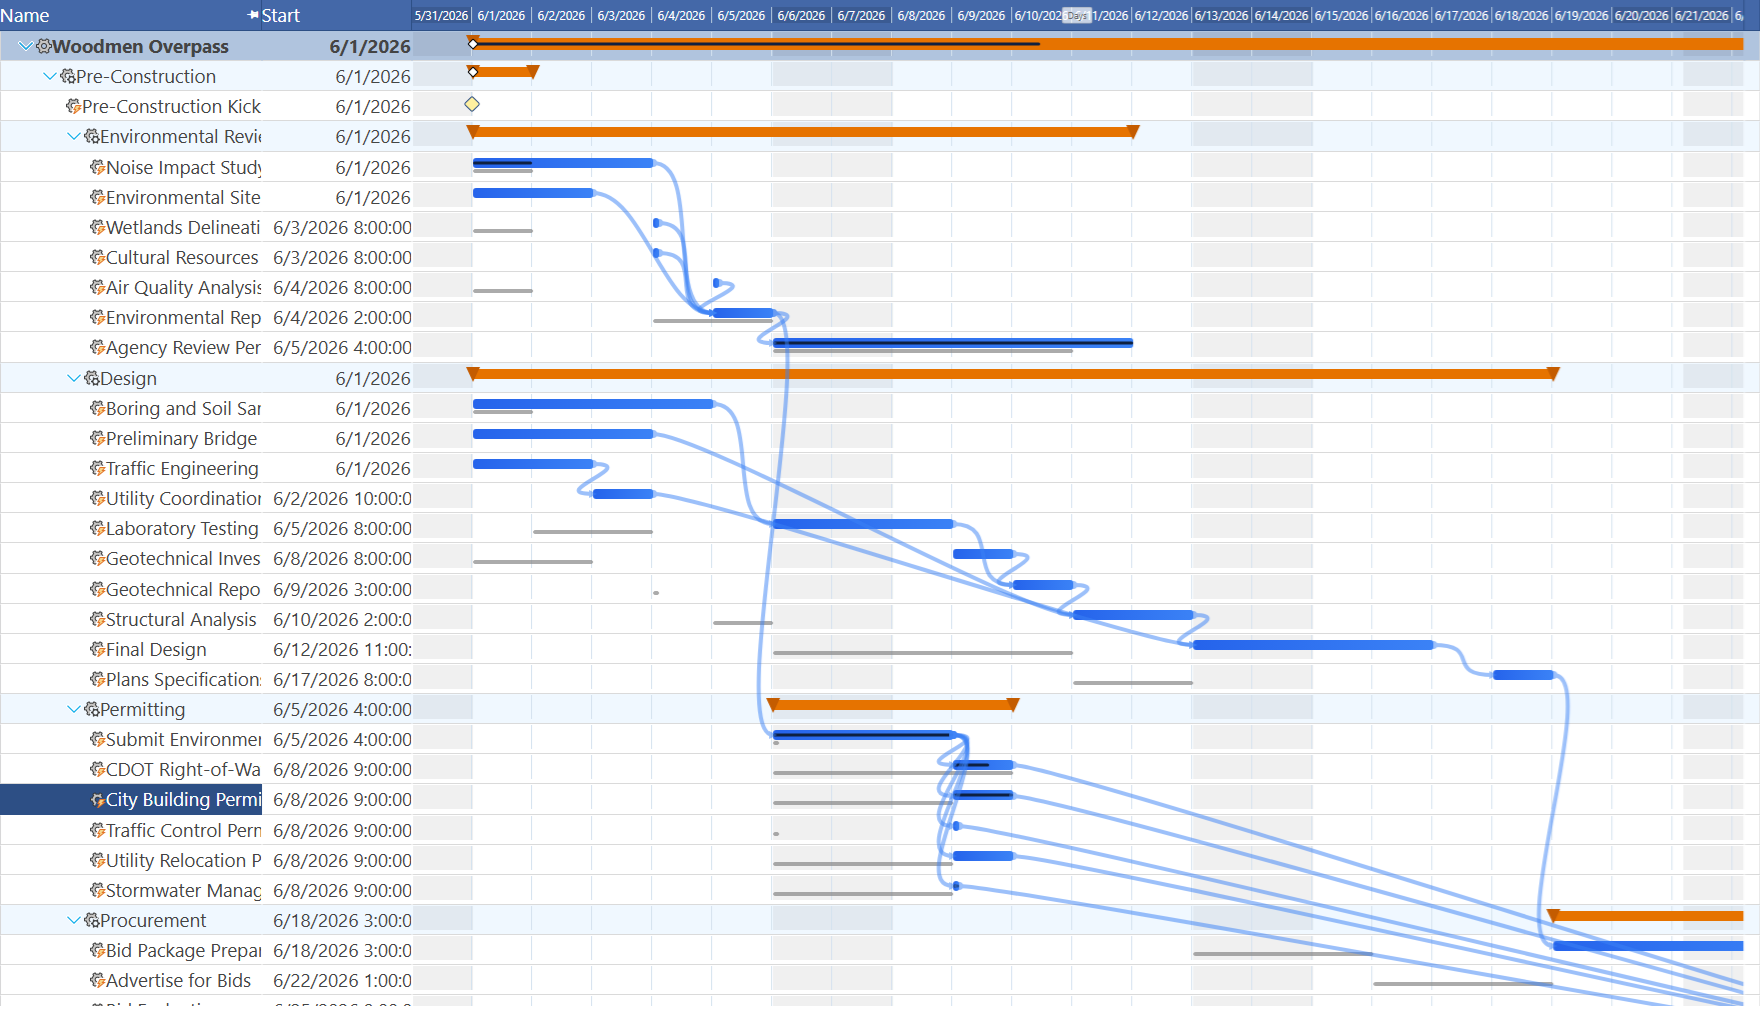
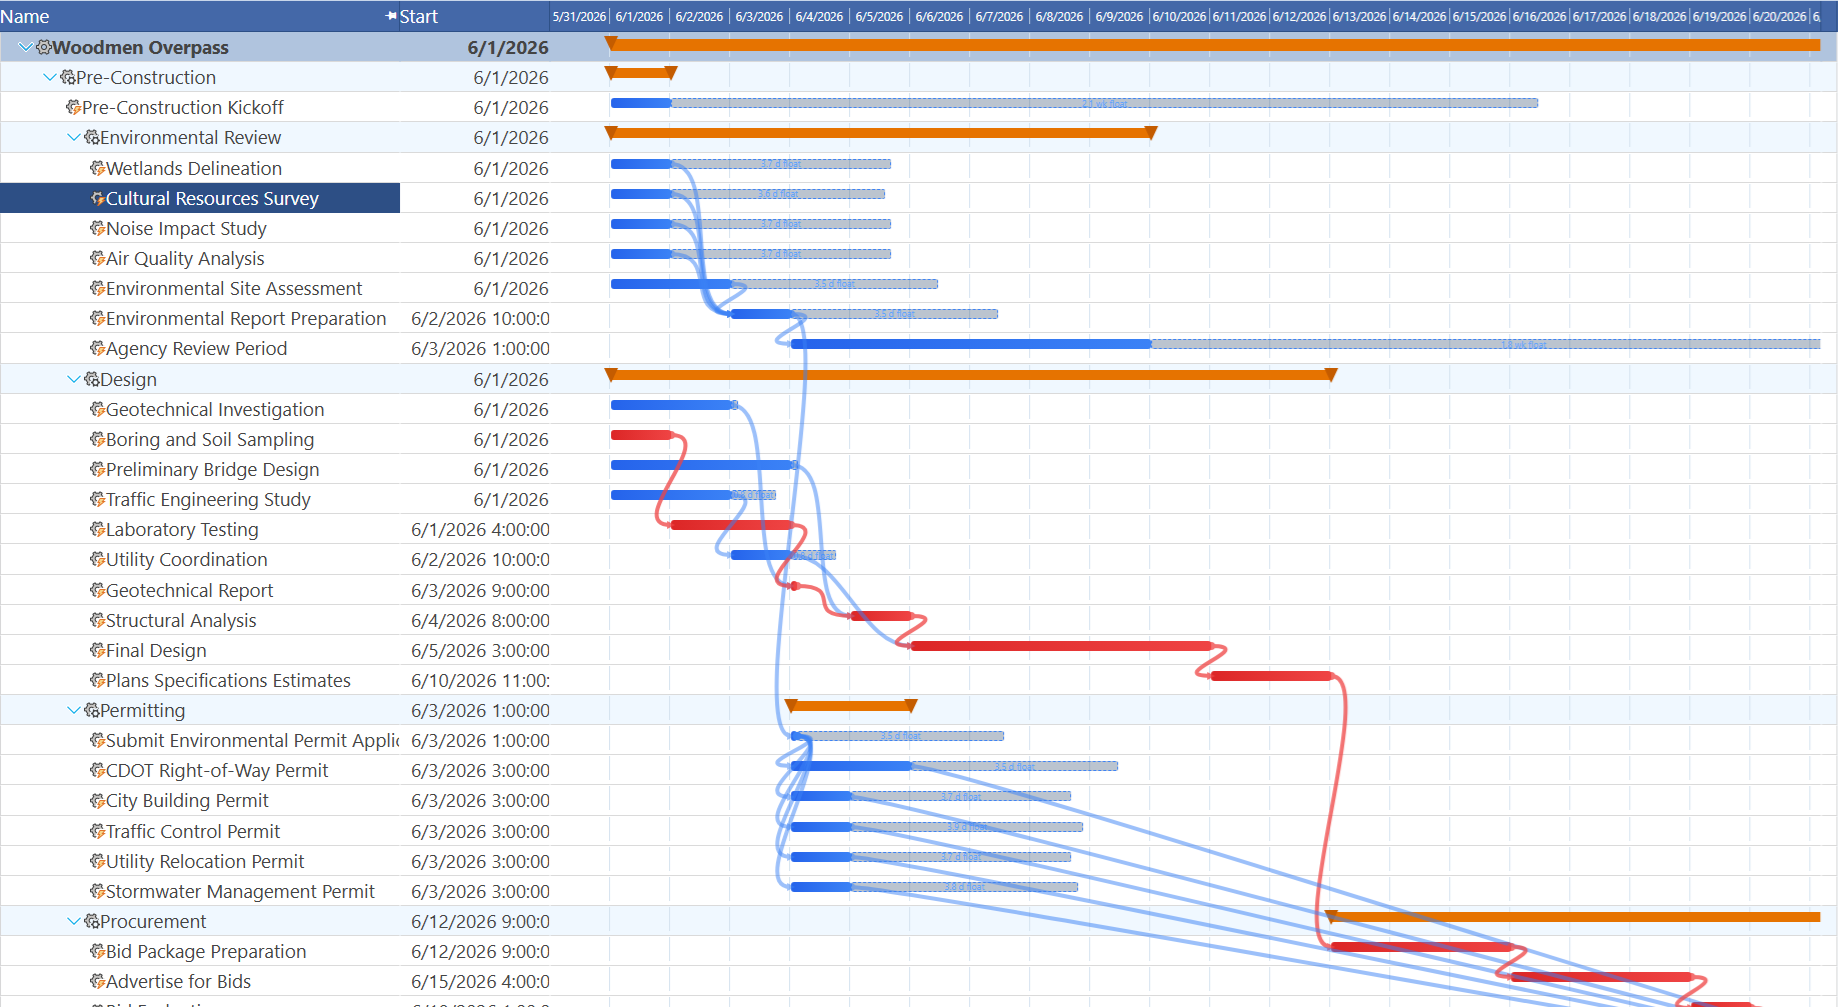
What to expect when the Gantt first renders. All 36 tasks will stack at the project start date with no span — durations and dependencies have not been entered yet. That is normal. The schedule will take its shape over the next two phases as you fill in durations and wire the dependency chain. Do not be concerned that the initial view looks like a bar code; it is correct.
Register Your Trade Crews and Materials
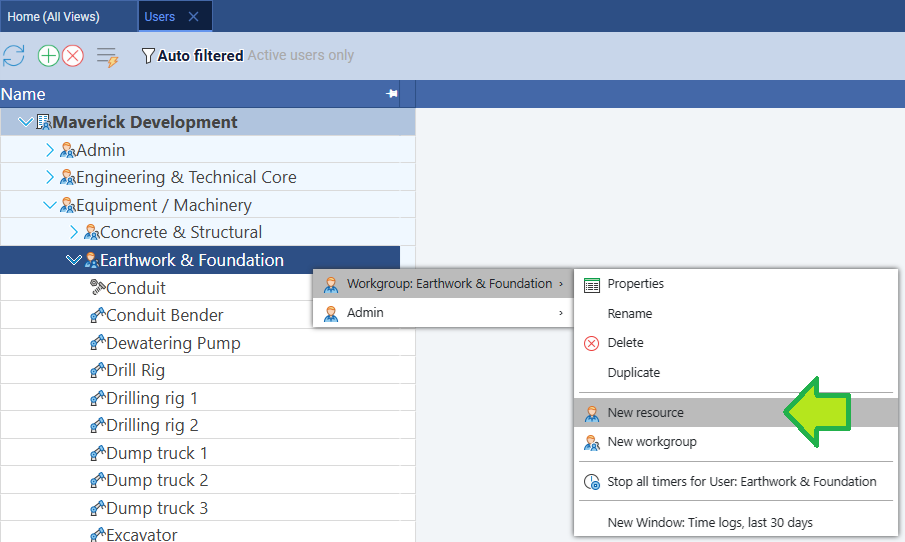
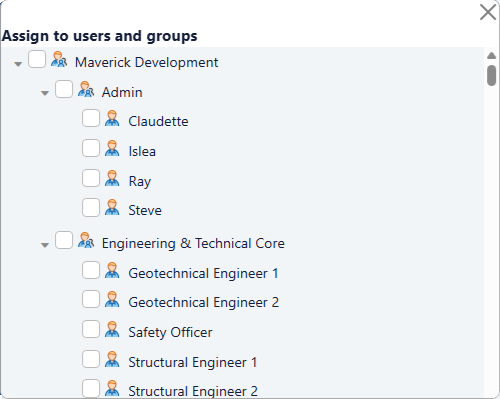
Resources in Maverick exist at the system level, not per project — you can create them now, before the task list is built, so that crew names are available to assign as you enter each task. Go to Home → Users, click a workgroup, then click the green + button to add each resource. Enter the name, choose the resource type (Human, Machine, or Material), and save.
- Human resources: HDD Contractor, Commissioning Engineer, Mechanical Crew, I&C Crew, Civil Crew, Pipeline Crew
- Machine resources: HDD Drill Rig
- Material resources: RO Membranes (360 elements), Chemical Reagents (anti-scalant, coagulant, chlorine)
Step 2: The Task Breakdown — 36 Tasks, One Hidden Risk
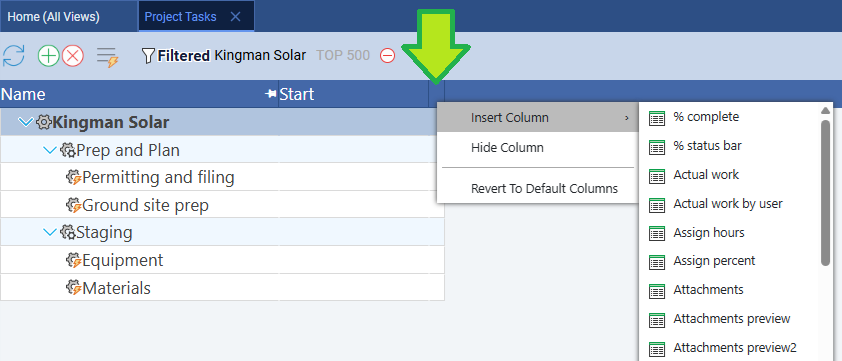
Enter the full task list using the simplified text editor: click any project row, find the Tasks property in the Properties panel, click it to open the editor, and indent subtask names under each phase. Then right-click a column header to insert Duration, Start, and Finish columns.
As you work through the list, the hidden risk is in Phase 1 of the construction project — the Membrane procurement task. It takes 2 working days to execute (prepare and submit the purchase order), but the membranes will not arrive on site for 14 weeks. That gap does not appear as task duration in the Gantt. It appears as a forced wait on the first RO Train A membrane loading task in Phase 5. If you do not wire that predecessor relationship explicitly, the Gantt will calculate Train A loading starting immediately after rack fabrication completes — showing a schedule three months shorter than reality. Add that link in Phase 3. For now, enter the task and note the lead time in the task name so it is visible in the grid.
| Phase | Task | Duration | Trade / Crew |
|---|---|---|---|
| 1 — Site Prep & Permits | Site survey & geotechnical boring | 5 days | Geotech Engineer |
| 1 — Site Prep & Permits | TCEQ permit application | 3 days | PM / Regulatory |
| 1 — Site Prep & Permits | EPA NPDES permit application | 3 days | PM / Regulatory |
| 1 — Site Prep & Permits | HDD rig equipment procurement | 2 days | PM / Procurement |
| 1 — Site Prep & Permits | Membrane procurement (14-week lead) | 2 days | PM / Procurement |
| 1 — Site Prep & Permits | Site access road & laydown area | 5 days | Civil Crew |
| 1 — Site Prep & Permits | Temporary power & site office | 2 days | Electrical Crew |
| 2 — Subsurface Intake | HDD pilot bore | 10 days | HDD Contractor |
| 2 — Subsurface Intake | HDD ream passes | 8 days | HDD Contractor |
| 2 — Subsurface Intake | Perforated screen casing installation | 5 days | HDD Contractor |
| 2 — Subsurface Intake | Gravel pack placement | 4 days | HDD Contractor |
| 2 — Subsurface Intake | Well pump & motor installation | 3 days | Mechanical Crew |
| 3 — Raw Water Pumping | Raw water pump station construction | 8 days | Civil / Mechanical |
| 3 — Raw Water Pumping | HDPE pipeline installation | 6 days | Pipeline Crew |
| 3 — Raw Water Pumping | Pump controls & instrumentation | 5 days | I&C Crew |
| 3 — Raw Water Pumping | Raw water storage tank construction | 10 days | Civil Crew |
| 4 — Pre-Treatment | Cartridge filter housing installation | 3 days | Mechanical Crew |
| 4 — Pre-Treatment | Chemical dosing systems (anti-scalant, coagulant) | 4 days | Mechanical Crew |
| 4 — Pre-Treatment | Pre-treatment instrumentation | 3 days | I&C Crew |
| 4 — Pre-Treatment | Backwash system piping | 4 days | Pipeline Crew |
| 4 — Pre-Treatment | Pre-treatment performance test | 3 days | Commissioning Eng |
| 5 — RO Membrane System | Pressure vessel rack fabrication | 8 days | Mechanical Crew |
| 5 — RO Membrane System | RO Train A — membrane loading | 2 days | Commissioning Eng |
| 5 — RO Membrane System | RO Train B — membrane loading | 2 days | Commissioning Eng |
| 5 — RO Membrane System | RO Train C — membrane loading | 2 days | Commissioning Eng |
| 5 — RO Membrane System | High-pressure pump installation | 4 days | Mechanical Crew |
| 5 — RO Membrane System | Energy recovery device installation | 3 days | Mechanical Crew |
| 6 — Post-Treatment | Remineralization & lime dosing system | 3 days | Mechanical Crew |
| 6 — Post-Treatment | Chlorination system | 2 days | Mechanical Crew |
| 6 — Post-Treatment | Permeate storage tank | 5 days | Civil Crew |
| 6 — Post-Treatment | Distribution tie-in | 3 days | Pipeline Crew |
| 7 — Testing & Commissioning | Flush & membrane conditioning | 3 days | Commissioning Eng |
| 7 — Testing & Commissioning | RO Train A performance test | 2 days | Commissioning Eng |
| 7 — Testing & Commissioning | RO Train B performance test | 2 days | Commissioning Eng |
| 7 — Testing & Commissioning | RO Train C performance test | 2 days | Commissioning Eng |
| 7 — Testing & Commissioning | Final regulatory compliance test | 3 days | Regulatory / TCEQ |
Watch for the lead time gap. When you wire the membrane procurement predecessor link in Phase 3, the Gantt will shift the entire Phase 5 and 6 sequence forward by roughly 14 weeks — which may push the project completion date past the date the water district board approved. That shift is not an error; it is the true schedule surfacing for the first time. If the resulting end date misses the contract date, the only way to recover it without adding staff is to start the membrane order earlier (move procurement into the pre-permit period if the supplier allows conditional orders) or to identify tasks in the HDD and pump system phases that can be compressed. Do not suppress the shift by skipping the predecessor link — a false schedule that hides a 14-week constraint is far more dangerous than a correct one that reveals a problem early.
Step 3: Three Link Types, One Shared Manifold
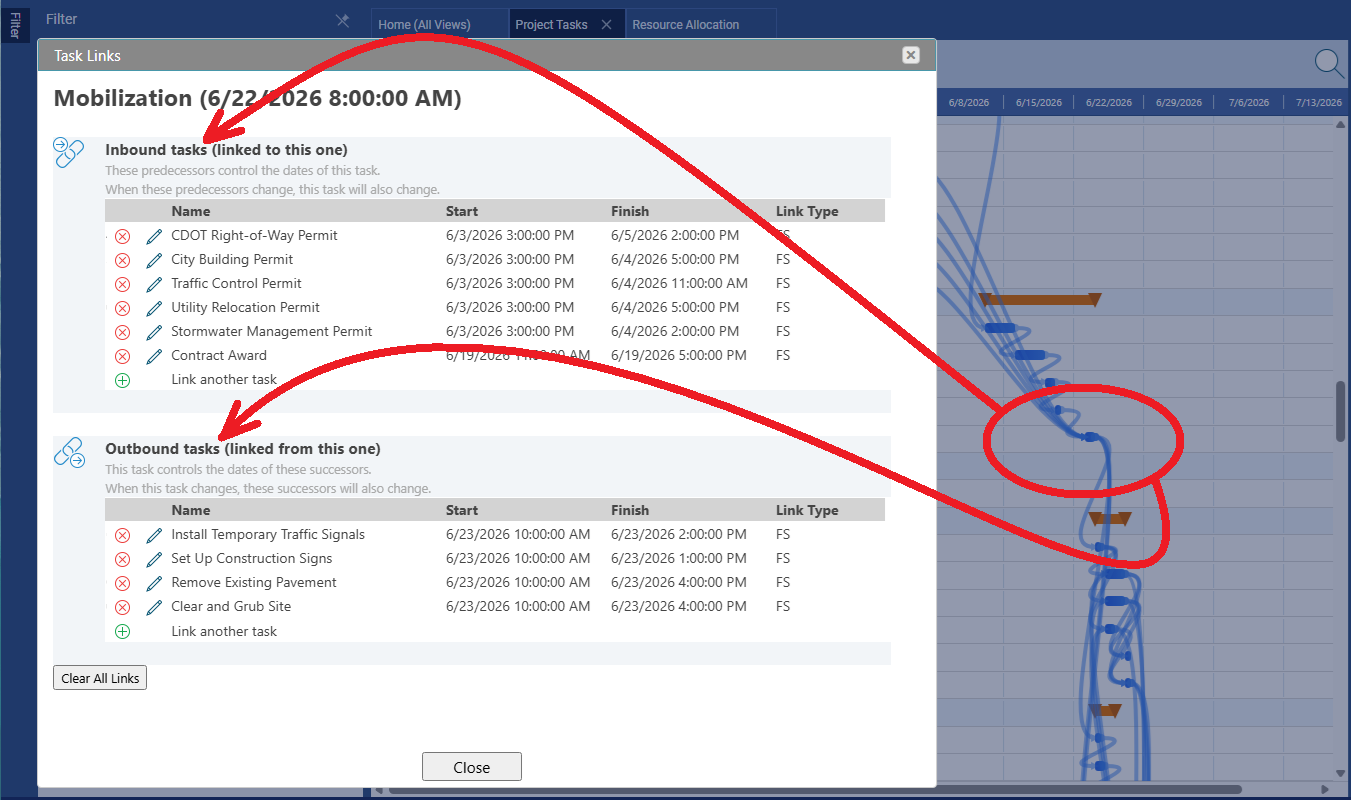
Most dependencies here are Finish-to-Start. The TCEQ permit must clear before the HDD rig mobilizes; the bore must be drilled before casing can go in; the pump station must be operational before pre-treatment equipment can be tested. Wire these by right-clicking any task, choosing Links…, clicking + under Outbound tasks, and selecting the successor. Also add the membrane procurement → RO Train A loading link here, using a lag equal to the 14-week delivery window in working days (approximately 70 working days).
The more interesting patterns are in Phase 5. The commissioning engineer loads membranes into RO Train A, then moves to Train B while Train A soaks, then to Train C. Rather than forcing a purely sequential chain, apply Start-to-Start links with a 1-day lag: Train B loading starts 1 day after Train A starts; Train C starts 1 day after Train B. This compresses Phase 5 by 2 days without creating a resource conflict — the overlap is exactly the soaking period during which the engineer is not needed on the previous train.
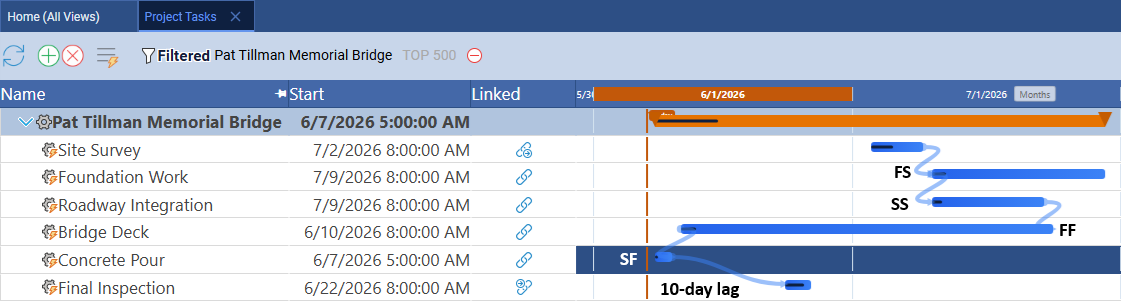
The third pattern is unique to this project. The high-pressure pump installation and the energy recovery device installation share a final bolted connection at the pressure exchanger manifold. Neither system can be signed off until the other is in position: the last act of both installations is torquing the shared flange. Link Energy recovery device installation as an outbound FF task from High-pressure pump installation. In the Gantt, the two bars can start independently and run in parallel, but their right edges are pinned together — if HPP slips one day, ERD automatically extends to match, because neither closes until the shared connection is ready.
Finish-to-Finish in plain English. A Finish-to-Finish link says: the successor cannot finish before the predecessor finishes. Both tasks can start whenever they are ready and run in parallel, but they must cross the finish line together (or the successor must finish after the predecessor). The Gantt draws FF arrows from end-of-bar to end-of-bar, visually distinct from the end-to-start arrows of FS links. In this project, HPP is the predecessor and ERD is the successor. The ERD crew can start installation on any available day, but the ERD task stays open until HPP signals it is ready for the final bolted connection. Once both are ready, both tasks close simultaneously.
Fun Fact: The Persian Gulf Paradox
The Energy Recovery Device task you just wired into the schedule matters far more on some projects than others — and the difference comes down to where in the world the plant sits. The Gulf states operate some of the world's largest desalinization infrastructure, supplying drinking water to tens of millions of people. They are also running those plants under the worst thermodynamic conditions on Earth for membrane technology. Aransas Bay, a brackish Texas estuary, is nearly the opposite end of the spectrum.
| Water Source | Salinity | Operating Pressure | Energy (kWh/m³) | Example |
|---|---|---|---|---|
| Brackish groundwater | 2–8 PPT | 10–20 bar | 0.5–1.2 | West Texas aquifer |
| Estuarine / bay water | 15–28 PPT | 15–30 bar | 1.0–2.0 | Aransas Bay, TX |
| Open ocean SWRO with ERD | 35–38 PPT | 55–70 bar | 2.5–4.5 | California, Singapore |
| Persian Gulf SWRO | 40–46 PPT | 65–80 bar | 3.5–6.0 | UAE, Saudi Arabia |
| Multi-Stage Flash (MSF distillation) | Any | Thermal (steam) | 10–15 | Gulf states (legacy plants) |
The Persian Gulf's salinity reaches 46 PPT near the Saudi coast — versus 35 PPT for the open Pacific — and summer water temperatures climb above 35°C. Both conditions increase the osmotic pressure the membranes must overcome, driving up energy consumption per cubic meter. Gulf states have historically compensated by operating multi-stage flash distillation plants (essentially large boiling systems) co-located with power stations, using waste heat from electricity generation. MSF is immune to salinity variation but consumes 5 to 10 times the energy of a modern RO system with pressure recovery. The ERD installation in Phase 5 of this blueprint is what separates a competitive coastal facility from a legacy thermal plant: the isobaric pressure exchanger captures up to 98% of the hydraulic energy in the high-pressure brine reject and transfers it directly back to the incoming feed, cutting net consumption by more than half. Learn more at the International Desalination Association.
Step 4: Assign Resources to Tasks
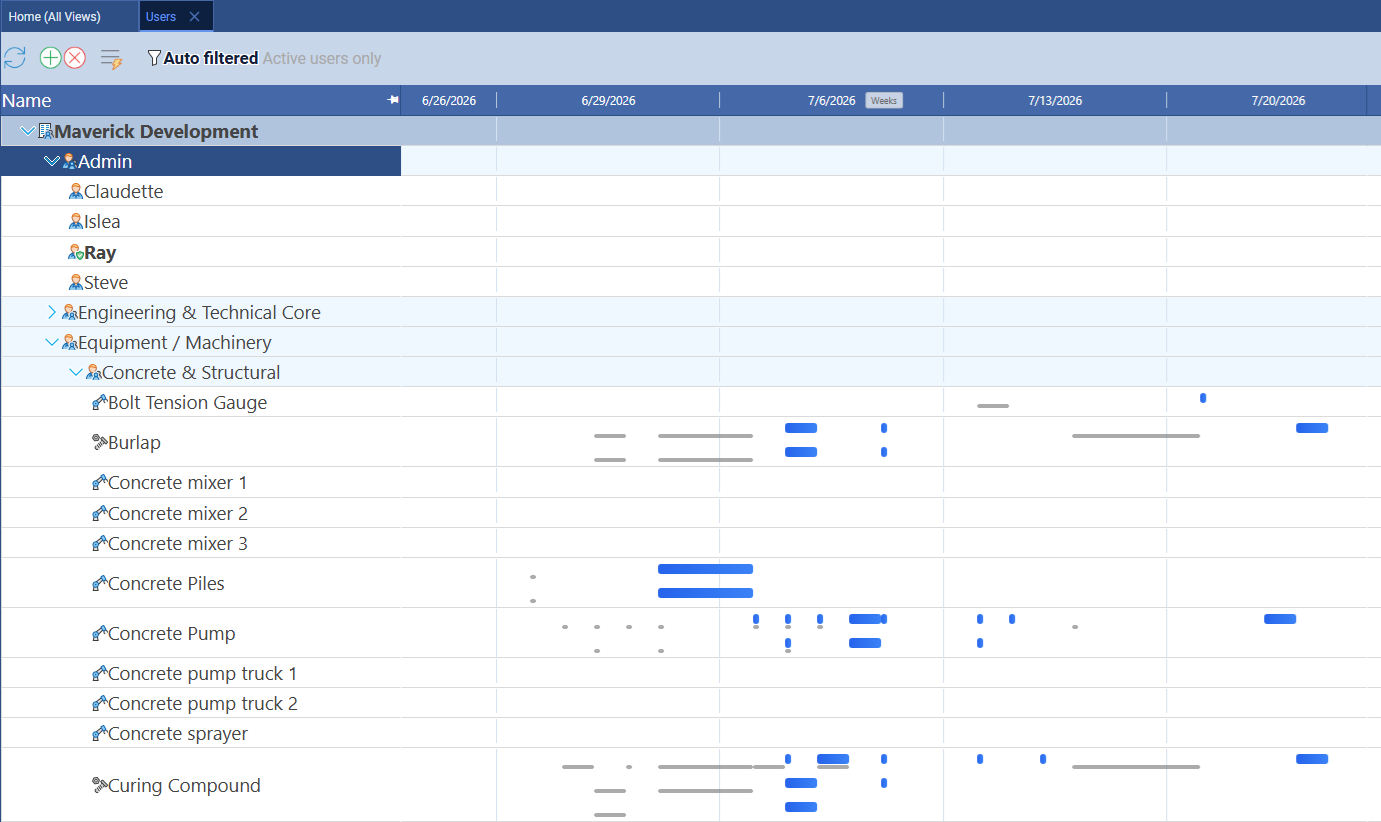
With the resource records already created, assign them to tasks. Click any task and choose from the Users dropdown in the Properties panel. Key assignments: HDD Contractor at 100% for all four boring and casing tasks; Commissioning Engineer at 100% for each membrane loading task and the flush and performance tests; RO Membranes at 120 elements per train. The resource-centric Gantt shows each crew's full task bar history across all projects — useful for spotting whether the Commissioning Engineer has overlapping commitments from other projects during the membrane loading window.
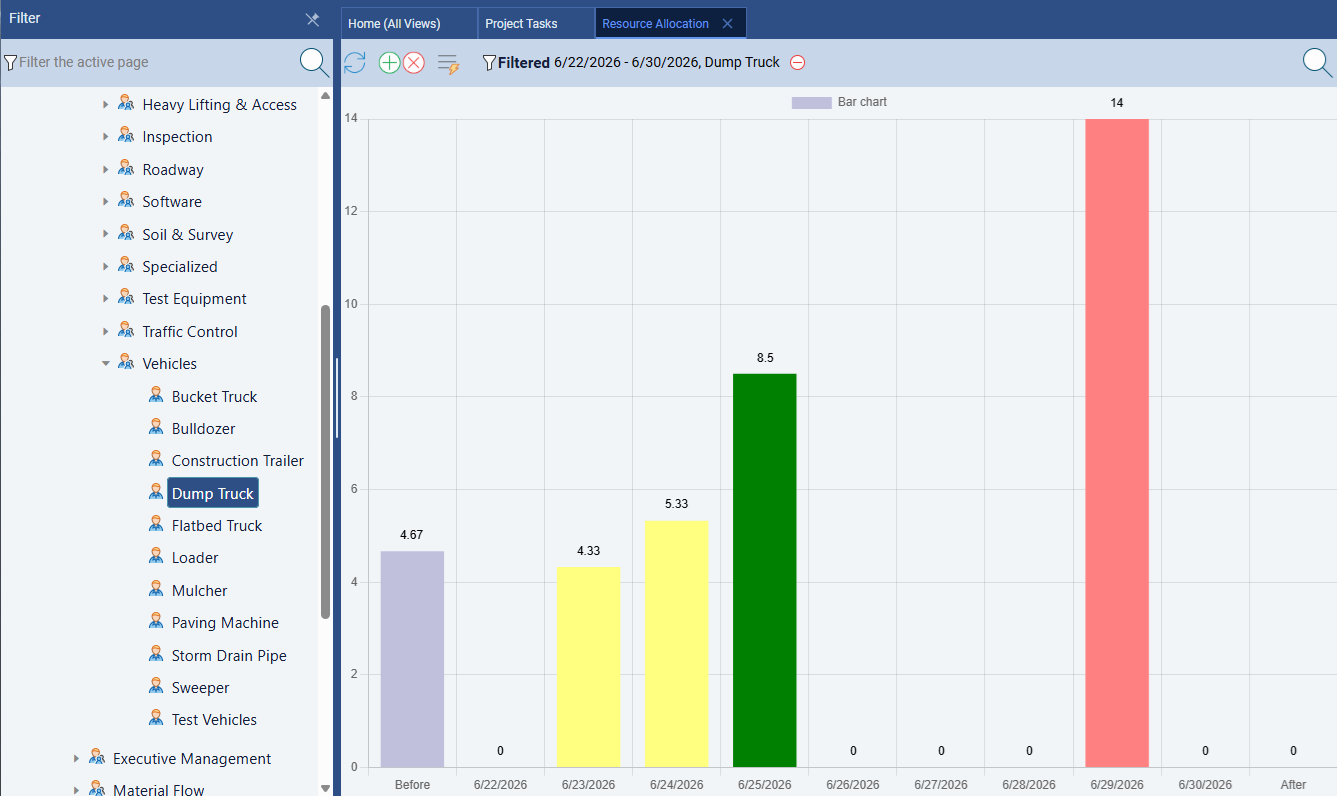
The Commissioning Engineer is the single-point constraint in Phase 5. This resource is assigned to membrane loading for all three trains, the flush and conditioning task, and all three performance tests — a continuous sequence with no gap. If the SS+1d lag between trains is too tight (the soaking cycle runs longer than one day), the engineer will appear double-booked in the resource allocation bar chart with a red overallocation bar. The fix is to increase the lag to match the actual soaking time before running the baseline. Do not carry an over-allocated commissioning engineer into the baseline — it means the schedule is physically impossible as drawn.
Step 5: A Baseline the Regulators Can Read
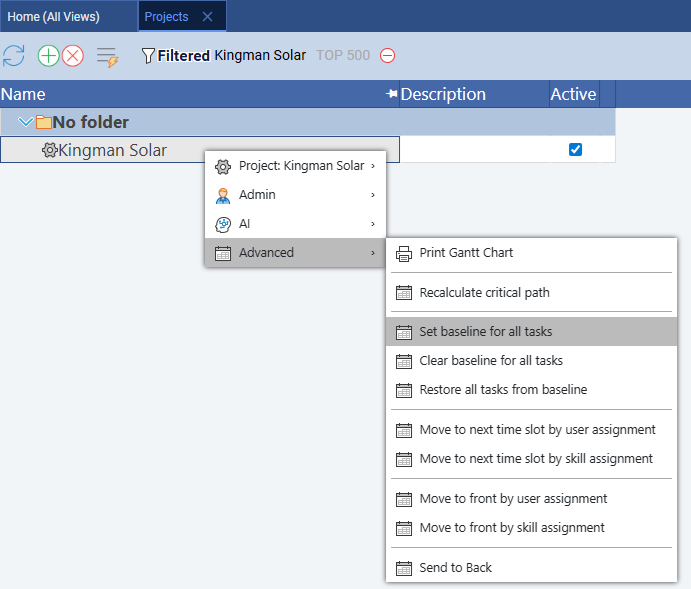
Texas Commission on Environmental Quality requires documented schedule baselines for public water infrastructure projects. Lock the baseline before any physical work begins — before the HDD rig arrives — so that every task slip is traceable to an approved plan. Right-click any project row and choose Advanced → Set baseline for all tasks.
Regulatory baselines require more precision than internal ones. On a private project you might set the baseline at project kickoff and update it at each phase gate. On a regulated public contract, the original baseline is the one that matters — it is the schedule the board approved and the permit was issued against. Any subsequent baseline change requires a formal scope-change order. Set it once, set it right, and do not update it without documentation. If a single phase slips and you are tempted to "rebaseline" to make the Gantt look cleaner, resist — the ghost bars showing accumulated drift are exactly what the regulator and the board need to see at the monthly progress review.
Step 6: When the Critical Path Runs Through a Desk
Right-click any project row and choose Advanced → Recalculate critical path. On most construction projects the critical path is all red bars in the field — excavation, structure, mechanical, electrical. On this project, the path starts at a desk: the TCEQ permit application is a red bar, because there is no float between permit approval and HDD mobilization. A one-week permit delay is a one-week project delay, with no way to recover it in the field.
After the permit, the critical path flows: Site access road → HDD pilot bore → HDD ream passes → Perforated casing → Gravel pack → Well pump → Pump station → Pump controls → Cartridge filter → Chemical dosing → Pre-treatment performance test → RO rack fabrication → RO Train A membrane loading → High-pressure pump installation → Flush & membrane conditioning → Train A performance test → Final regulatory compliance test.
Notable float: the geotechnical survey can run in parallel with permit applications (3 days of float). The raw water storage tank has 3 days of float before it blocks pre-treatment. RO Trains B and C have 1 day of float each due to their SS+1d lag. The EPA NPDES permit has float — it must clear before brine discharge at commissioning, but that date is weeks after TCEQ governs construction start.
Look for red bars in administrative phases, not just construction. On most Gantt charts you expect to see red in the heavy construction phases and blue in the permitting and closeout sections. A project where permitting is on the critical path tells you something about the owner's risk posture: they either started construction planning too late relative to the regulatory timeline, or the permit process for this jurisdiction is unusually slow. Either way, the Gantt surface the problem — a red permit bar is an early warning that the schedule has a constraint outside the contractor's control, and that constraint should be escalated to the project owner immediately, not managed quietly in the field.
Step 7: Week 10 — The Pump Station Slip
Advance to Week 10. The HDD bore sequence is complete — pilot bore, ream passes, perforated casing, and gravel pack all show 100%. The well pump finished one day early. But the raw water pump station hit a problem on Day 4: the foundation concrete pour was delayed by a supplier shortage, pushing the task two days behind. Mark the pump station at 70% complete. Pump controls and instrumentation has not started. The storage tank is at 50%.
Look at the Gantt. The pump station's live bar extends two days past its baseline ghost. Now watch what happens downstream: pump controls cannot start until the pump station completes, so it shifts two days. Cartridge filter installation follows pump controls, so it shifts two more. Chemical dosing follows cartridge filters. Pre-treatment performance testing follows chemical dosing. RO rack fabrication follows pre-treatment. RO Train A membrane loading follows rack fabrication. And so on through flush, conditioning, all three performance tests, and the final compliance test. A two-day concrete delay in Week 3 of the pump station becomes a two-day shift in the project completion date — visible as a consistent 2-day gap between ghost and live bar across 20 downstream tasks.
Check the resource allocation bar chart. If the Civil Crew is simultaneously finishing the storage tank and starting the pump station recovery work in the same week, you may see red overallocation bars — a crew trying to be in two places at once.
Log timesheet hours instead of setting percent complete directly. The pump station delay scenario above was entered by editing percent complete manually. In production, the preferred method is the timesheet: go to Home → Timesheet, find the pump station row for each Civil Crew member, and enter daily hours at the rate actually worked during the concrete-delay period. Maverick calculates percent complete from accumulated hours and updates the Gantt fill bar in real time. The advantage for a regulated public contract is that the variance report to the water board can reference logged hours by date and crew member, not just a percent-complete field that someone typed in. Auditable time records are far more defensible than estimated progress percentages.
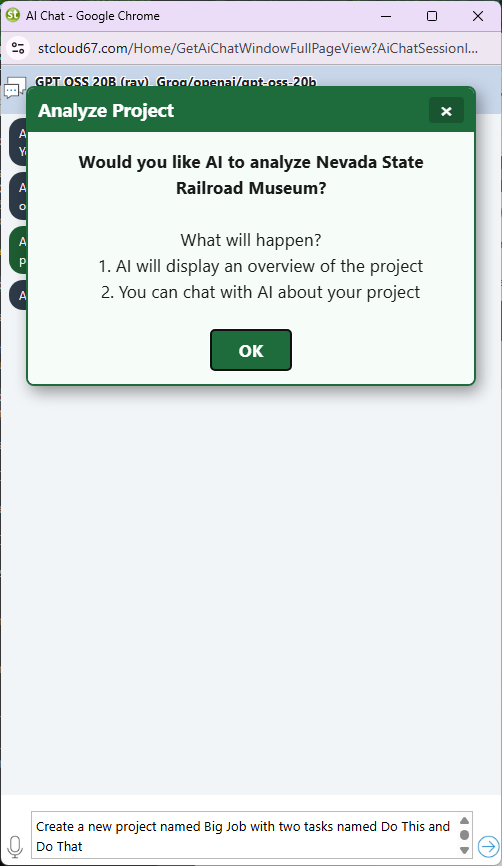
Step 8: Ask the AI to Trace the Cascade
Right-click the project row and choose AI → Chat with AI. Click OK to analyze the full schedule, then enter the core question this scenario raises:
The raw water pump station construction is running two days behind due to a concrete pour delay. Trace the full cascade: which tasks are affected, by how many days each, and does the two-day slip reach the final regulatory compliance test? What is the fastest schedule recovery that does not require adding staff or working overtime?
The AI reads the dependency chain and returns a specific answer: yes, the compliance test shifts by two days, and the most schedule-efficient recovery (without new resources) is to overlap the pre-treatment performance test with the last day of instrumentation commissioning by adding a Finish-to-Finish link with a 1-day offset. Click OK to apply the change, then review the updated Gantt to confirm the compliance test date has recovered.
Quick prompts to try on the Aransas Bay project:
- Which tasks are on the critical path and what is the float for each non-critical task?
- The TCEQ permit is delayed by one week. Which tasks are affected and by how much?
- How much float remains between the membrane procurement delivery date and the first RO Train A loading task?
- The commissioning engineer is double-booked during membrane loading. Suggest a revised SS lag between trains that eliminates the conflict.
- Add a 3-day weather contingency buffer to the HDD boring sequence without extending the compliance test date.
- The energy recovery device installation finished one day early. Does that accelerate the high-pressure pump FF tie-in or does HPP still control the finish?
- Summarize project status at Week 10: tasks complete, in progress, and at risk of missing baseline.
- Draft a one-paragraph variance report for the water district board explaining the pump station delay and the recovery plan.
Step 9: Public Contract Cost Reporting
The water district board approved a fixed budget, and the general contractor must report actual versus quoted cost at each phase milestone. Maverick tracks internal cost (hourly rate × hours logged), client cost (billing rate × hours), and material cost (unit cost × quantity). For the HDD contractor, who bills lump-sum per linear foot of bore, enter the full bore contract value as a quoted cost on the Phase 2 summary task.
Set rates on each human resource by clicking the resource in the Users list and entering Hourly Rate and Billing Rate. For RO Membranes (material resource), enter the unit cost per element. As timesheets are submitted, Maverick accumulates actual cost automatically. Add cost columns to the task grid by right-clicking a column header and inserting Cost (Client), Actual Cost, Material Cost, and Quoted Cost. Quoted phase budgets for this project:
- Site Preparation & Permits: $450,000
- Subsurface Intake Installation: $2,100,000
- Raw Water Pumping System: $850,000
- Pre-Treatment System: $620,000
- RO Membrane System: $2,400,000
- Post-Treatment & Distribution: $480,000
- Testing & Commissioning: $380,000
Configure the 90% and 100% cost alert thresholds under notification preferences. A 90% alert gives time to prepare an explanation for the board before the overrun is confirmed — a 100% alert means the overrun has already happened.
Related Topics
For a full explanation of Gantt chart task bars, link lines, and baseline ghost bars, see Gantt Charts in Project Management. For how Maverick calculates zero-float tasks and what permit delays mean for schedule risk, see Critical Path Method. For the full workflow of setting, clearing, and restoring baselines for regulatory documentation, see Project Baselines: Set, Clear, and Restore. To compare how a different large construction project handles its dependency chain — one with a hard utility deadline instead of a permit constraint — see the 5MW Solar Plant Buildout blueprint.