
What Is the Maverick OData Feed?
Maverick exposes your project data as a live OData feed — a standard HTTP/JSON API that business intelligence tools understand natively. Instead of exporting CSV files and importing them manually, you connect Power BI once and refresh on demand. Every time you click Refresh in Power BI, it pulls the latest records directly from your Maverick database.
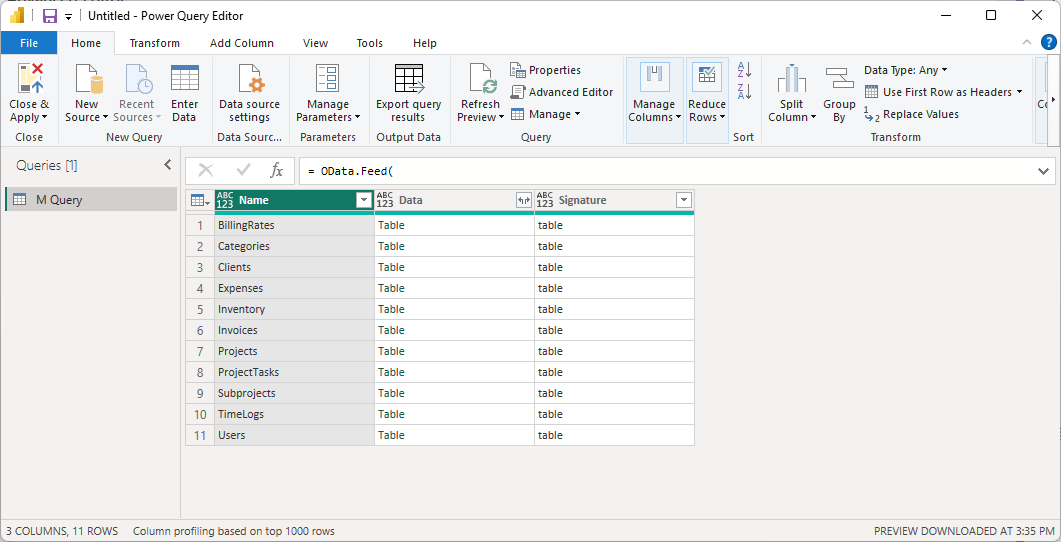
The feed covers eleven entity sets spanning the full project management data model:
- TimeLogs — every timesheet entry, with user, project, task, category, hours, cost, and billable status
- Projects — project records with start/finish dates, client, status, quoted cost, and billing type
- ProjectTasks — task records with dates, duration, percent complete, actual hours, and cost fields
- Subprojects — phases and subproject hierarchy within each project
- Users — employees and resources with workgroup, role, rates, and hire date
- Clients — client company records with contact details and billing settings
- Expenses — expense entries with amount, category, billable status, and reimbursement flags
- Inventory — inventory items with stock quantities, cost, and vendor information
- Categories — work categories with billing rates
- Invoices — invoice records with totals, due dates, and payment status
- BillingRates — rate schedule records by user, project, category, and role
Supported query parameters: $filter, $select, $orderby, $top, $skip, and $count. You can filter by any field, select only the columns you need, and page through large result sets. Authentication is handled by an API key you pass as an HTTP header on every request. For a full listing of every entity's properties, Edm types, and FK relationships, see the OData Schema Reference.
Install Power BI Desktop
Power BI Desktop is Microsoft's free report-building application. It runs on Windows and connects to hundreds of data sources including OData feeds. The easiest way to install it is through the Microsoft Store — updates install automatically and no administrator rights are required.
Install from the Microsoft Store
- Press the Windows key and type Microsoft Store, then press Enter.
- In the search bar, type Power BI Desktop and press Enter.
- Select Power BI Desktop from the results (published by Microsoft Corporation).
- Click Get (or Install) and wait for the download to complete.
- Click Open to launch it, or find it in the Start menu.
Power BI Desktop is free and does not require a Microsoft 365 subscription to build and view reports locally. Publishing reports to the Power BI cloud service for sharing requires a paid Power BI Pro license, but that is not needed for the local reporting shown in this guide.
Generate Your API Key
Every OData request must include an API key. Maverick generates these keys per user from within the application itself.
- Open Maverick and log in with your account.
- Find the API Keys button in the ribbon toolbar.
- Click it to open the API Key Manager.
- Click Generate New API Key.
- Give the key a label — for example, Power BI — so you can identify it later.
- Copy the key immediately. It will not be shown again in full after you close this dialog.
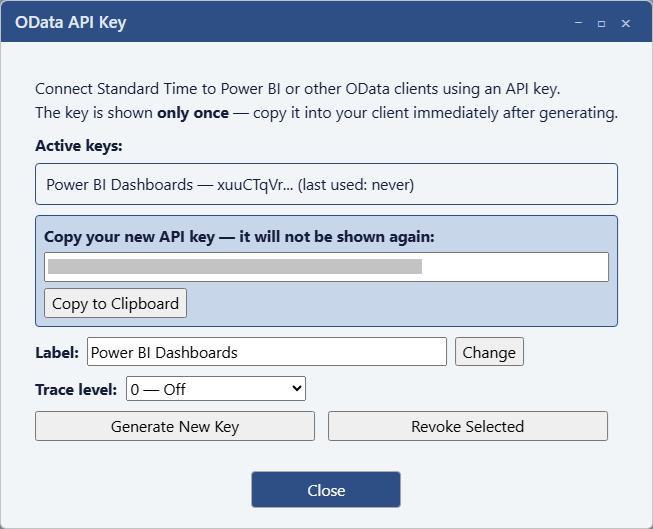
Keep your API key private. Anyone who has it can read your project data via the OData feed. If a key is ever compromised, delete it in the API Key Manager and generate a new one.
Cloud vs. On-Premise: the CID Parameter
The example queries throughout this guide use a URL like:
https://stcloud67.com/odata/TimeLogs?cid=YOUR_CID_HERE
YOUR_CID_HERE is just a placeholder for these examples. Your real CID is a long alphanumeric string assigned when your organization's Maverick cloud account was created — it will be much longer than the short placeholder shown here.
The CID tells the Maverick cloud server which company database to query. You can find your CID in your Maverick account settings or in the URL when you are logged into the cloud site at stcloud67.com.
If Maverick is installed on-premise (on your own server), you do not need a CID at all. Your base URL is simply your server's address, and no cid parameter is needed:
https://your-server.com/odata/TimeLogs
Connect Power BI to Maverick
The cleanest way to connect is with a Blank Query, which lets you paste a complete M query including the API key header. Maverick's OData feed requires this header — Power BI's built-in "OData feed" connector does not support custom headers without going through Power Query.
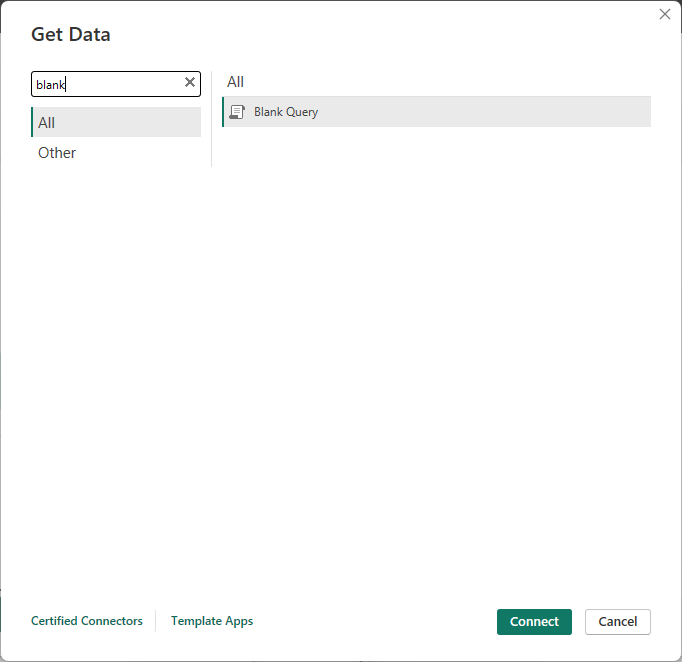
Step 1 — Open a Blank Query
- In Power BI Desktop, click the Home tab.
- Click the arrow below Get Data to open the dropdown.
- Select Blank Query. The Power Query editor opens.
Step 2 — Open the Advanced Editor
- In the Power Query editor, click the Home tab.
- Click Advanced Editor.
Step 3 — Paste the M Query
- Select all the placeholder text in the Advanced Editor and delete it.
- Paste one of the queries from the M Query Reference section below.
- Replace
YOUR_CID_HEREwith your actual CID (cloud) — or remove the&cid=…portion entirely (on-premise). - Replace
YOUR_API_KEYwith the key you generated. - Click Done.
Step 4 — Preview the Results
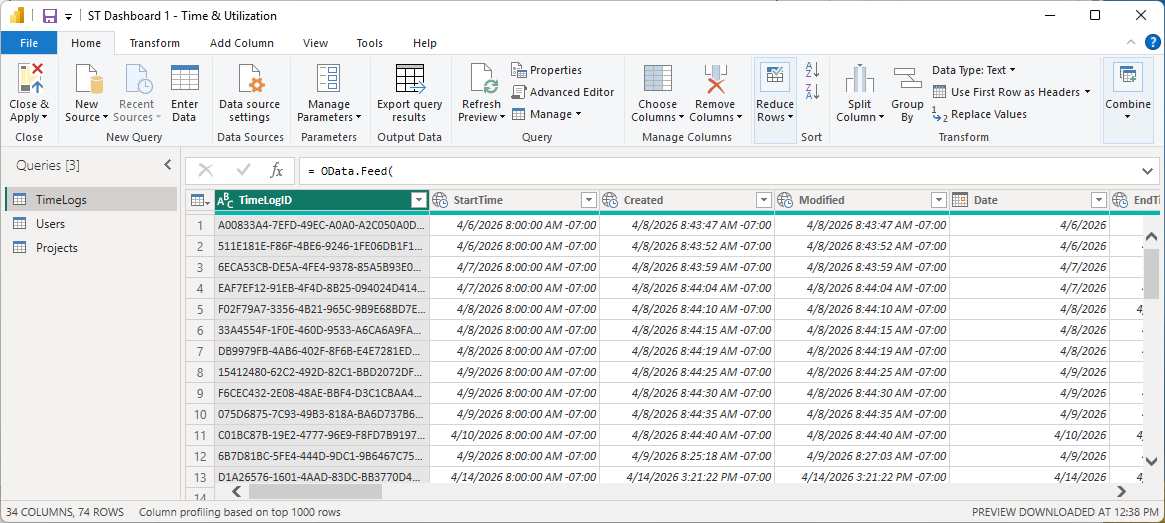
After clicking Done, Power Query fetches a preview of the first page of records. If the API key and URL are correct, you will see your Maverick data appear as a table in the query editor.
Step 5 — Rename the Query and Repeat
- In the Query Settings pane on the right, rename the query from Query1 to the entity name — for example, TimeLogs.
- Repeat Steps 1–4 for each entity set you want: Projects, ProjectTasks, Users, and so on.
- When all queries are added, click Close & Apply on the Home tab.
M Query Reference
Each query below is ready to paste into the Power BI Advanced Editor. Replace YOUR_CID_HERE with your actual company ID and YOUR_API_KEY with your API key. For on-premise installations, remove the &cid=YOUR_CID_HERE portion from the URL — it is not needed.
Queries that include a DaysBack variable pull only records created within that rolling window. Increase the number to load more history, or set it to a large value like 9999 to load all records. Start with the defaults shown here — loading everything at once can be slow on large databases.
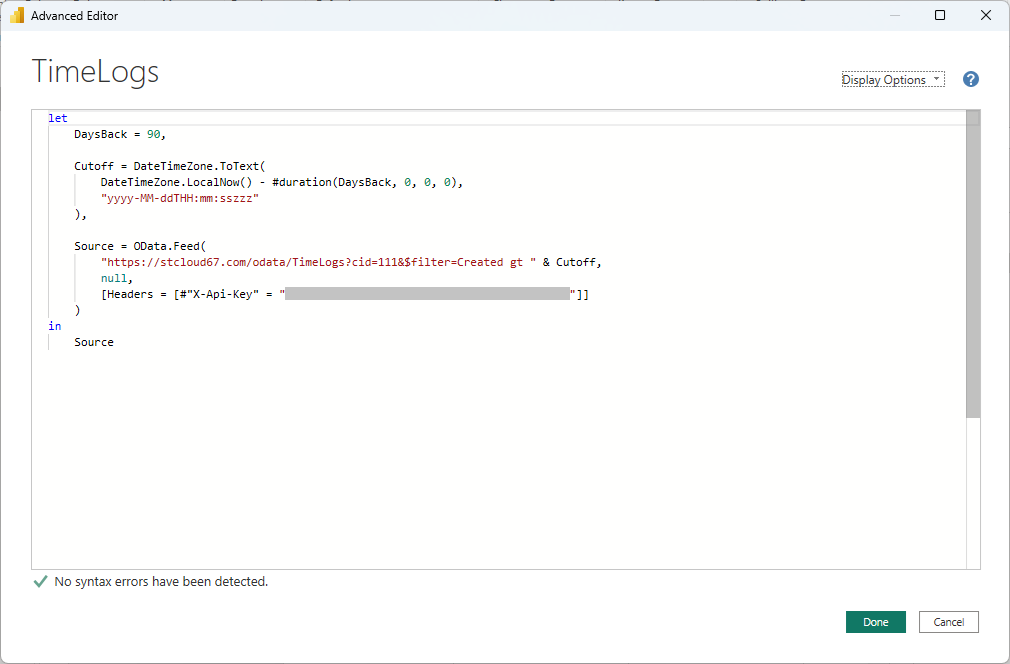
TimeLogs
let // Fetch only time logs created in the last N days. // Increase DaysBack to load more history; set to 9999 for all records. DaysBack = 14, // Build an ISO 8601 DateTimeOffset string using the local machine's UTC offset, // e.g. "2026-06-08T08:00:00-05:00". The OData feed compares this against the // Created column on the TimeLogs table. Cutoff = DateTimeZone.ToText( DateTimeZone.LocalNow() - #duration(DaysBack, 0, 0, 0), "yyyy-MM-ddTHH:mm:sszzz" ), Source = OData.Feed( "https://stcloud67.com/odata/TimeLogs?cid=YOUR_CID_HERE&$filter=Created gt " & Cutoff, null, [Headers = [#"X-Api-Key" = "YOUR_API_KEY"]] ) in Source
Projects
let DaysBack = 30, Cutoff = DateTimeZone.ToText( DateTimeZone.LocalNow() - #duration(DaysBack, 0, 0, 0), "yyyy-MM-ddTHH:mm:sszzz" ), Source = OData.Feed( "https://stcloud67.com/odata/Projects?cid=YOUR_CID_HERE&$filter=Created gt " & Cutoff, null, [Headers = [#"X-Api-Key" = "YOUR_API_KEY"]] ) in Source
ProjectTasks
let DaysBack = 30, Cutoff = DateTimeZone.ToText( DateTimeZone.LocalNow() - #duration(DaysBack, 0, 0, 0), "yyyy-MM-ddTHH:mm:sszzz" ), Source = OData.Feed( "https://stcloud67.com/odata/ProjectTasks?cid=YOUR_CID_HERE&$filter=Created gt " & Cutoff, null, [Headers = [#"X-Api-Key" = "YOUR_API_KEY"]] ) in Source
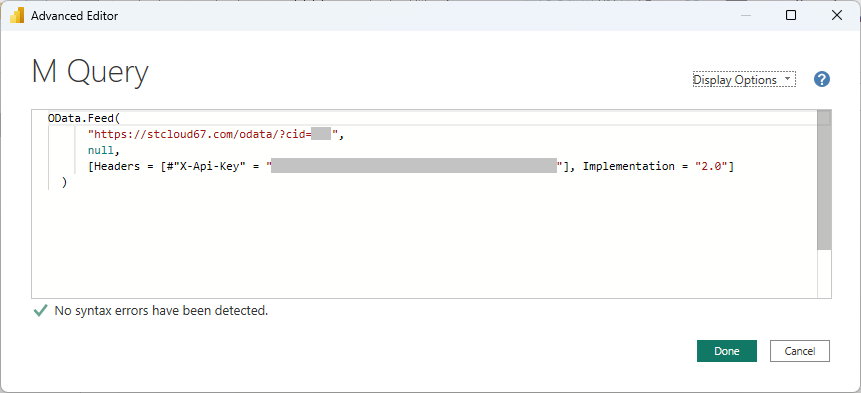
Subprojects
let Source = OData.Feed( "https://stcloud67.com/odata/Subprojects?cid=YOUR_CID_HERE", null, [Headers = [#"X-Api-Key" = "YOUR_API_KEY"]] ) in Source
Users
let Source = OData.Feed( "https://stcloud67.com/odata/Users?cid=YOUR_CID_HERE", null, [Headers = [#"X-Api-Key" = "YOUR_API_KEY"]] ) in Source
Clients
let Source = OData.Feed( "https://stcloud67.com/odata/Clients?cid=YOUR_CID_HERE", null, [Headers = [#"X-Api-Key" = "YOUR_API_KEY"]] ) in Source
Expenses
let DaysBack = 90, Cutoff = DateTimeZone.ToText( DateTimeZone.LocalNow() - #duration(DaysBack, 0, 0, 0), "yyyy-MM-ddTHH:mm:sszzz" ), Source = OData.Feed( "https://stcloud67.com/odata/Expenses?cid=YOUR_CID_HERE&$filter=Created gt " & Cutoff, null, [Headers = [#"X-Api-Key" = "YOUR_API_KEY"]] ) in Source
Inventory
let Source = OData.Feed( "https://stcloud67.com/odata/Inventory?cid=YOUR_CID_HERE", null, [Headers = [#"X-Api-Key" = "YOUR_API_KEY"]] ) in Source
Categories
let Source = OData.Feed( "https://stcloud67.com/odata/Categories?cid=YOUR_CID_HERE", null, [Headers = [#"X-Api-Key" = "YOUR_API_KEY"]] ) in Source
Invoices
let Source = OData.Feed( "https://stcloud67.com/odata/Invoices?cid=YOUR_CID_HERE", null, [Headers = [#"X-Api-Key" = "YOUR_API_KEY"]] ) in Source
BillingRates
let Source = OData.Feed( "https://stcloud67.com/odata/BillingRates?cid=YOUR_CID_HERE", null, [Headers = [#"X-Api-Key" = "YOUR_API_KEY"]] ) in Source
Build Table Relationships
With multiple queries loaded, Power BI can join them so you can build cross-table reports — for example, total hours per project, expenses by client, or task completion by user. Switch to the Model view (the icon that looks like three connected boxes in the left sidebar) to define these relationships.
The key relationships to create:
- TimeLogs[ProjectID] → Projects[ProjectID] — links each time entry to its project
- TimeLogs[UserID] → Users[UserID] — links each time entry to the employee who logged it
- TimeLogs[ClientID] → Clients[ClientID] — links each time entry to the client
- ProjectTasks[ProjectID] → Projects[ProjectID] — links tasks to their parent project
- Subprojects[ProjectID] → Projects[ProjectID] — links phases to their project
- Expenses[ProjectID] → Projects[ProjectID] — links expenses to their project
- Projects[ClientID] → Clients[ClientID] — links each project to its client
- Invoices[ClientID] → Clients[ClientID] — links invoices to the client billed
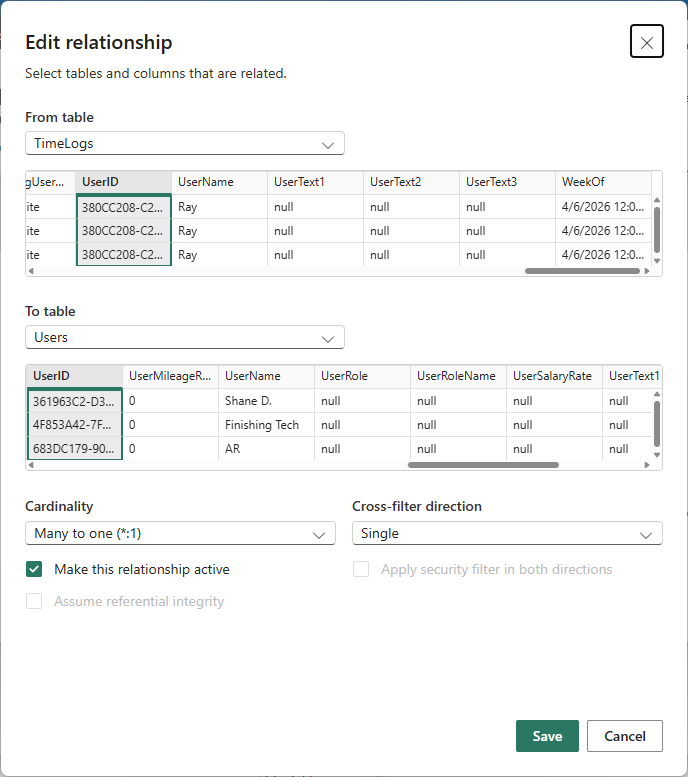
To create a relationship: drag a field from one table and drop it onto the matching field in another table. Power BI draws a line between them and infers the cardinality automatically (typically many-to-one from TimeLogs to Projects).
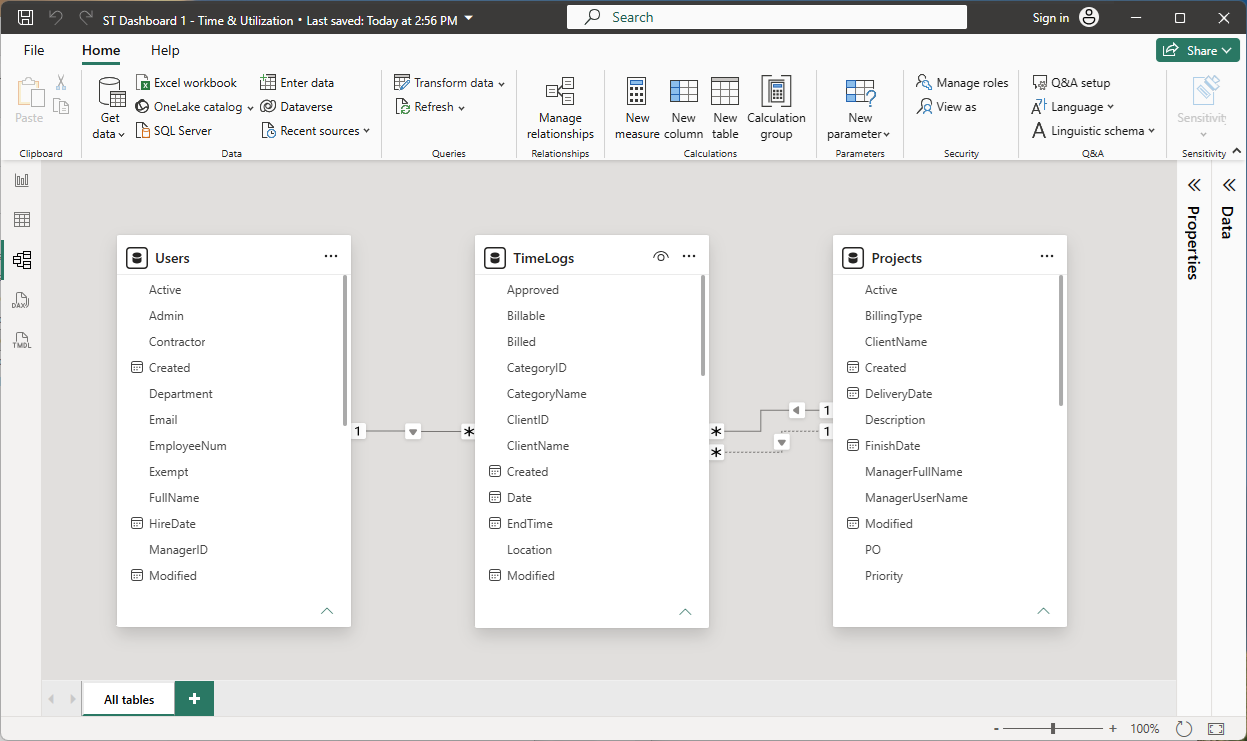
You can also click the Manage relationships button on the Home tab to review and edit each relationship, verify the join columns, and set the cross-filter direction.
Add DAX Measures
DAX (Data Analysis Expressions) measures let you define calculations that aggregate, filter, and combine your data. Add them in the Report or Data view by right-clicking a table and choosing New measure.
Here are the most useful starting measures for Maverick data:
Total Hours
Total Hours = SUM(TimeLogs[TimeLogDurationHours])
Billable Hours
Billable Hours = CALCULATE( SUM(TimeLogs[TimeLogDurationHours]), TimeLogs[Billable] = TRUE() )
Total Client Cost
Total Client Cost = SUM(TimeLogs[TimeLogCostClient])
Task Completion %
Avg Task Completion = AVERAGE(ProjectTasks[PercentComplete])
Remaining Hours
Remaining Hours = SUM(ProjectTasks[RemainingHours])
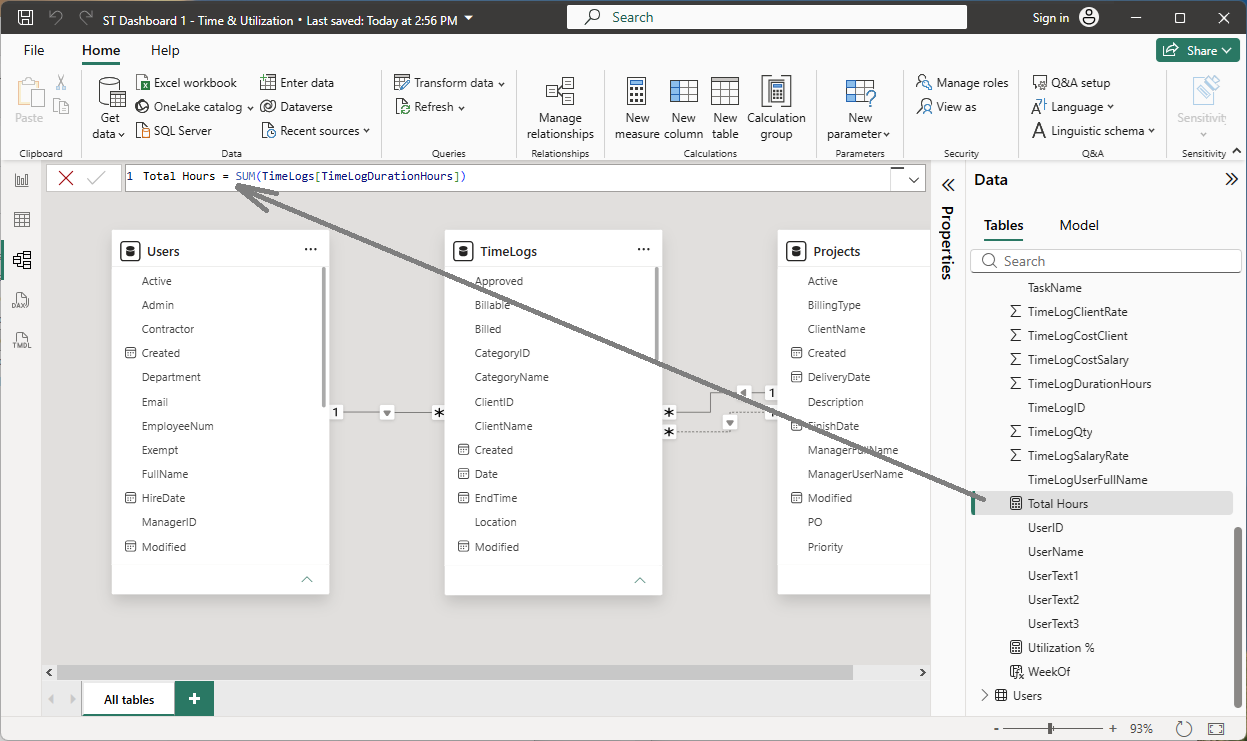
Once defined, measures appear in the field list under their table and can be dropped into any visual — bar charts, tables, cards, gauges, and more.
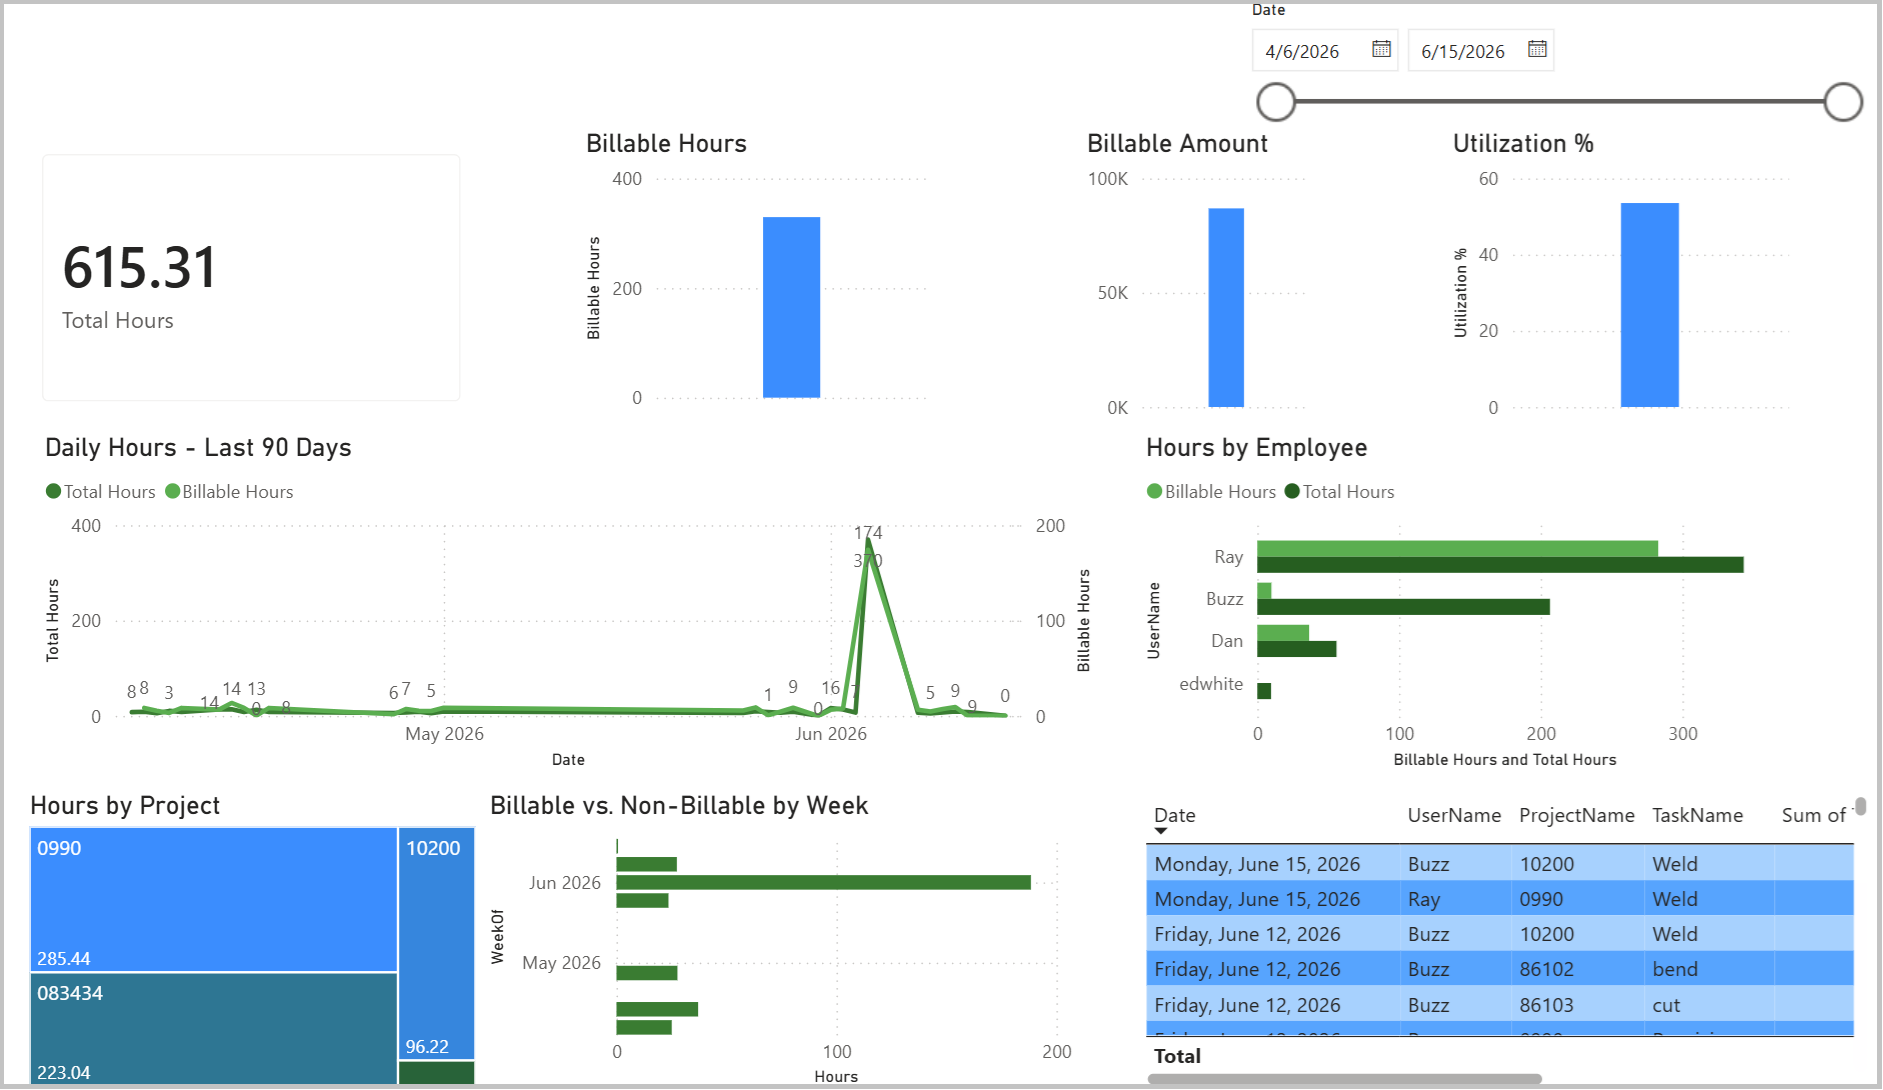
Build Your Report
Switch back to the Report view (the bar chart icon in the left sidebar) to start adding visuals. Drag fields and measures from the data pane on the right onto the canvas. Common starting points:
- Bar chart — drag Users[FullName] to the Y-axis and Total Hours measure to the X-axis for a user utilization chart.
- Table — add Projects[ProjectName], Total Hours, and Billable Hours for a project summary table.
- Slicer — drop TimeLogs[Date] onto a slicer visual to filter the entire report by date range.
- Card visual — drop Total Client Cost for a single-number KPI tile.
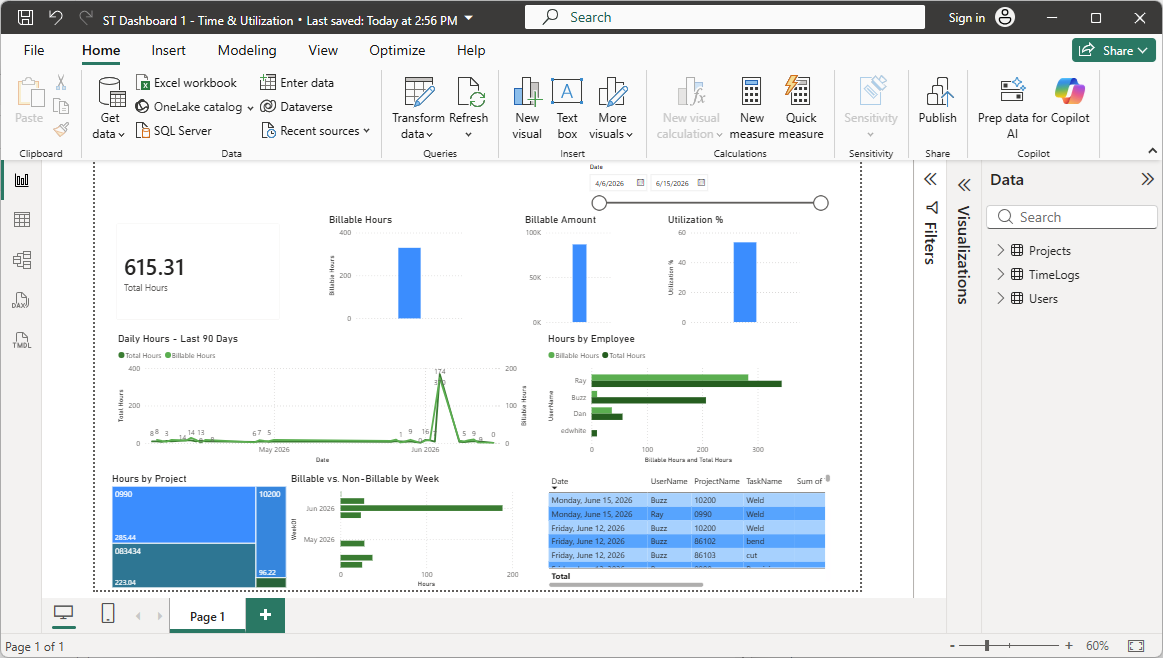
Use Home → Refresh at any time to pull the latest data from your Maverick database. The DaysBack variable in each M query determines how far back the refresh looks — adjust it in the Advanced Editor as your dataset grows.
OData Entity Reference
All endpoints accept $filter, $select, $orderby, $top, $skip, and $count. Append the CID parameter for cloud (?cid=YOUR_CID_HERE) or omit it for on-premise. The API key is always passed as the X-Api-Key request header.
| Entity Set | URL Path | Key Field | Common Filter Fields |
|---|---|---|---|
| TimeLogs | /odata/TimeLogs |
TimeLogID |
Created, Date, UserName, ProjectName, Billable, Approved |
| Projects | /odata/Projects |
ProjectID |
Created, StartDate, FinishDate, Active, ClientName |
| ProjectTasks | /odata/ProjectTasks |
TaskID |
Created, StartDate, FinishDate, Completed, ProjectName |
| Subprojects | /odata/Subprojects |
SubsystemID |
ProjectID, ProjectName, Active |
| Users | /odata/Users |
UserID |
Active, Workgroup, ResourceType, UserRole |
| Clients | /odata/Clients |
ClientID |
Active, CompanyName |
| Expenses | /odata/Expenses |
ExpenseID |
Created, ExpenseDate, Billable, Approved, Reimbursed |
| Inventory | /odata/Inventory |
InventoryID |
Active, Status |
| Categories | /odata/Categories |
CategoryID |
Active, ProjectID |
| Invoices | /odata/Invoices |
InvoiceID |
DateSent, PaidInFull, ClientName |
| BillingRates | /odata/BillingRates |
BillingRateID |
StartDate, EndDate, RateType, UserName |
Filter Syntax Quick Reference
| Operator | Meaning | Example |
|---|---|---|
eq |
equals | $filter=Billable eq true |
ne |
not equal | $filter=Active ne false |
gt |
greater than | $filter=Created gt 2026-01-01T00:00:00-05:00 |
lt |
less than | $filter=FinishDate lt 2026-12-31 |
and |
both conditions | $filter=Billable eq true and Approved eq true |
$select |
limit columns | $select=UserName,TimeLogDurationHours,Date |
$orderby |
sort | $orderby=Date desc |
$top |
limit rows | $top=500 |
Beyond Power BI: Excel and Other OData Clients
Maverick's OData feed is a standard HTTP/JSON API, not a Power BI-specific connector. Any application that can consume OData feeds or make authenticated HTTP requests can read your Maverick data. The same M queries that work in Power BI Desktop work identically in Excel's Power Query.
Excel Power Query
Excel includes the same Power Query engine as Power BI Desktop. The M queries on this page paste directly into Excel with no changes:
- In Excel, click the Data tab.
- Click Get Data → From Other Sources → Blank Query.
- In the Power Query editor, click Home → Advanced Editor.
- Paste any query from the M Query Reference section above.
- Replace
YOUR_CID_HEREandYOUR_API_KEYas described. - Click Done, then Close & Load.
The data loads into an Excel table. From there you can build PivotTables, PivotCharts, and VLOOKUP-based summaries just as you would with any Excel data. Click Data → Refresh All at any time to pull updated records from Maverick.
Other OData Clients
Any tool that supports OData v4 or authenticated HTTP/JSON can connect to the Maverick feed. Common options beyond Power BI and Excel:
- Tableau — use the OData connector in Tableau Desktop, passing the API key as a custom HTTP header.
- Python / pandas — use the
requestslibrary to call the endpoint and load the JSONvaluearray into a DataFrame. - Power Automate — use the HTTP action with the
X-Api-Keyheader to pull data into automated flows. - Any REST client — Postman, Insomnia, or curl work for ad-hoc queries and debugging. Pass
X-Api-Key: YOUR_KEYas a request header and the response is standard JSON with an@odata.contextenvelope and avaluearray.
The EDMX metadata document — which describes every entity type, property name, and data type in machine-readable format — is available at /odata/$metadata. Like all Maverick OData endpoints, it requires the X-Api-Key request header. Because HTTP headers cannot travel in a URL, this endpoint cannot be opened by simply pasting an address into Chrome — a 401 Unauthorized error will result.
The easiest way to browse it is the free ModHeader Chrome extension. Install it, add a request header named X-Api-Key with your API key as the value, then paste this URL into Chrome's address bar:
https://stcloud67.com/odata/$metadata?cid=YOUR_CID_HERE
ModHeader injects the header automatically on every matching request. Disable or remove the rule when you are done. Postman and curl are also good options. Most OData-aware tools (Power BI, Excel) send the API key header automatically once configured, so they can import this schema document without any manual steps.